Thursday, December 14, 2006

The U.S. Mint Is Implementing A New Rule Abolishing the Melting of Pennies and Nickels

I have mentioned several times over the past year that I am hording pennies and nickels. We are currently in the midst of a commodities boom and the value of precious metals and non-precious metals (such as those used in current U.S. coins) has soared for the past 2 or 3 years. There are several reasons for the soaring prices that I will not discuss in detail here in this post (although I may discuss it in a future post), but among the chief reasons for this boom is the strong global demand for metals due to strong worldwide economic growth, as well as a devaluation of the U.S. dollar by the Federal Reserve that has increase the U.S. dollar value of commodities.

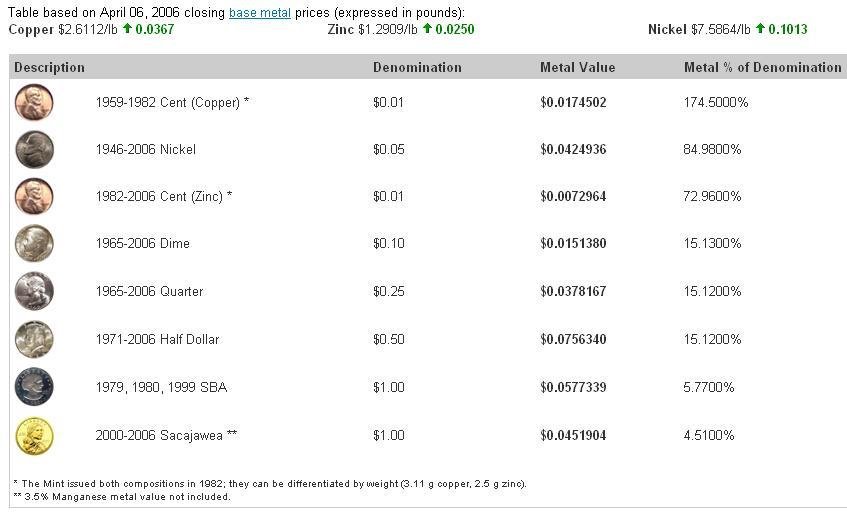
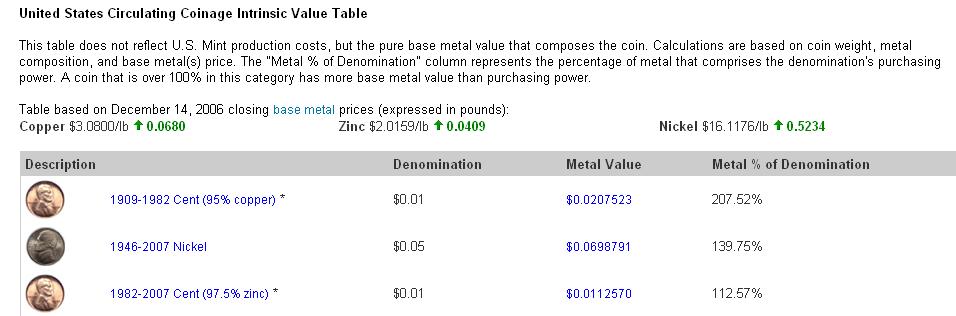
The value of the metals within several U.S. coins, including pennies and nickels, now exceeds the face value of the coins, as shown in the picture below that I acquired from coinflation.com, the best website I've seen for determining the intrinsic metal of various coins (click on the picture for a larger view). As one can see, the metal value of pre-1982 pennies is now 2.0752 cents (207.52% of face value), post-1982 zinc pennies have a metal value of 1.1257 cents (112.57% of face value), and nickels have a metal value of 6.9879 cents (139.75% of face value).


To realize the intrinsic metal value of these coins, one would need to melt them down to separate out the respective valuable metals. Up until yesterday, my understanding was that this practice was not illegal. I've never done so myself or heard of anyone actually doing so, but I read somewhere that this practice would not be prohibited.

The U.S. Mint has apparently been losing money by making pennies and nickels over the past year as it pays more for the metals used to make the coins that it receives in return when it sells the coins at face value to banks, etc. As of today, the U.S. Mint has made it illegal to melt down pennies and nickels. It is also illegal to transport more than $100 worth of pennies and/or nickels out of the country unless it is for legitimate coinage purposes. The penalty for violation of this new rule is a penalty of up to five years in prison and a fine of up to $10,000 for people convicted of violating the rule.

In case anyone had any doubts about whether collecting pennies and nickels is worthwhile, the U.S. Mint's implementation of the new rule should quell such doubts. It's only a matter of time until the U.S. Mint changes the metal composition of pennies and nickels to include less expensive metals, a move that would likely increase the collectible value of current pennies and nickels.

Thursday, December 07, 2006

November 2006 Returns For My Model Long-Term Portfolio

November was another great month for my Hypothetical Model Portfolio. As of the market close on November 30, 2006, the Hypothetical Model Portfolio* increased in value by $3934.75, or about 3.46% during the month of November. The Hypothetical Model Portfolio is now up $17,812.56 in 2006, a gain of 17.81%, as shown on the table below (click for a larger image of the table).

Emerging markets led the way in November, with the Templeton Russia closed-end fund (TRF)appreciating about 13.86% and the iShares Emerging Markets ETF (EEM) returning about 5.98%. Mid caps, small caps, and tech stocks were also strong performers. The Vanguard Mid Cap Index (VIMSX), the Vanguard Small Cap Index (NAESX), Vanguard Small Cap Value Index (VISVX), and the Nasdaq 100 ETF (QQQQ) rose 3.83%, 3.04%, 3.10%, and 3.43%, respectively. The only other ETF or fund to return more than 3% in November was the Vanguard Developed Markets Index mutual fund (VDMIX), which returned about 3.83%. (VDMIX tracks the broad-based foreign stock MSCI EAFE index.)

The poorest portfolio performers in November were my holdings that invest in stocks of large cap companies and dividend-focused ETFs. The Vanguard Index 500 fund (VFINX), S&P 500 Financial components ETF (XLF), and iShares Dow Jones U.S. Select Dividend Index Fund (DVY) returned 1.88%, 1.63%, and 0.71%, respectively.

The stock market continues to look strong as 2006 comes to an end. With a slight surge in December, my Hypothetical Model Portfolio can close the year up 20%.

*The Hypothetical Model Portfolio was hypothetically created with an investment of $100,000 with investments made as of the closing values on December 30, 2005. The reason why the total cost in the chart is greater than $100,000 is because the total cost accounts for the value of dividends reinvested into the mutual funds in the portfolio.


October 2006 Returns

Thursday, November 16, 2006

Home Depot Is Raising Its Dividend By 50% For The Second Time During 2006

Home Depot (symbol: HD) announced today that it is raising its dividend by 50% to 22.5 cents per quarter, beginning with the dividend being paid on November 30, 2006. This is the second time Home Depot has raised its dividend during 2006. Back in Jaunary 2006, Home Depot announced it was raising its dividend from 10 cents per quarter to 15 cents per quarter. So that is a total increase of 125% in Home Depot's quarterly dividend this year! Back in 1999 Home Depot paid 2.75 cents/quarter. Its dividends have therefore increased some 718% since 1999. The odd thing is that Home Depot is still trading below where it was in 1999 despite the huge increase in its dividend and a more than 200% increase in its earnings per share.

I wrote a post back in February where I argued that Home Depot is a "strong buy." I still believe that Home Depot is a good-long term buy. It may not perform well over the short term, but as its earnings and dividends continue to rise Wall Street will eventually take notice and bid its shares higher like it did during the 90s. The Value Line projects that Home Depot will trade between $95 and $125/share between 2009-2011, a gain of between about 160% and 245%.

Sunday, November 12, 2006

Best Posts Over The Past Year

I started my Finance and Investments blog on November 8, 2005. I have posted 77 times since then, discussing a number of topics primarily focusing on stock market investing (including tracking a model portfolio), basic coin collecting, and general personal finance issues. Here are some of my favorite posts from the past year:

Best posts relating to Stock Market Investing:
(1) Selling stocks short
(2) Historical Dividends for the S&P 500
(3) The "FED Model" theory of equity valuation
(4) The MSCI EAFE index is the "S&P 500" of foreign stocks
(5) Small Cap Value stocks outperform Large Cap Growth stocks
(6) "Periodic Table" of Equity Style Investment Returns for 1986-2005
(7) Investing In Growth Stocks Is Not For The Faint Of Heart
(8) Criticisms of Dollar-Cost Averaging Investment Strategies Are Unjustified
(9) Stock Market Styles Are Very Cyclical
(10) Think Twice Before Investing In Companies That Manufacture Memory Devices Or Other Electronic "Commodities"
(11) The Templeton Russia & East European Fund
(12) Closed-end funds are the best way for the common man to invest in Russia and India
(13) Wal-Mart's Stock Valuation Looks Compelling

Best posts relating to Coin Collecting:
(1) Save Your Pre-1982 Pennies
(2) With Commodities Are Soaring, I am Saving Nickels and Pre-1982 Pennies
(3) I'm Still Saving U.S. Nickel Coins

Best posts relating to Miscellaneous Personal Finance Issues:
(1) "Revolt of the Fairly Rich"
(2) Robert Kiyosaki Has Written Another Flimsy Article For Yahoo Finance
(3) Everbank Provides An Easy Way To Speculate In Foreign Currency And Precious Metals

Wednesday, November 08, 2006

October 2006 Returns For My Model Long-Term Portfolio

October was a great month from my Hypothetical Model Portfolio. As of the market close on October 31, 2006, the Hypothetical Model Portfolio* increased in value by $4482.79, or about 4.10% during the month of October. The Hypothetical Model Portfolio is now up $13,877.81 in 2006, a gain of 13.88%, as shown on the table below (click for a larger image of the table).

The iShares Emerging Markets ETF (EEM) led the portfolio higher, returning 7.06% for the month. Small caps and tech stocks were also strong performers. The Vanguard Small Cap Index (NAESX), Vanguard Small Cap Value Index (VISVX), and Nasdaq 100 ETF (QQQQ) rose 5.20%, 4,82%, and 4.75%, respectively.

The only laggards during October were the S&P 500 Financial components ETF (XLF) and the Templeton Russia closed-end fund (TRF) , returning 2.87% and losing 0.16%, respectively.

Two of my holdings paid dividends during October. As I mentioned in a previous post, the dividends from mutual fund holdings are reinvested, but the dividends from ETFs or the closed end fund (i.e., the Templeton Russia closed-end fund (TRF)) are not reinvested- they will accumulate as "CASH" on the performance table below. The iShares Dow Jones U.S. Select Dividend Index Fund (DVY) paid a dividend of $0.5662 (a total of $45.30 ), and XLF paid a dividend of $0.194/share (a total of $15.33).

Stocks look good heading toward the end of 2006. With a strong finish during November and December, my Hypothetical Model Portfolio could close the year up 15-20%.

*The Hypothetical Model Portfolio was hypothetically created with an investment of $100,000 with investments made as of the closing values on December 30, 2005. The reason why the total cost in the chart is greater than $100,000 is because the total cost accounts for the value of dividends reinvested into the mutual funds in the portfolio.


September 2006 Returns

Thursday, November 02, 2006

Fidelity's Magellan Fund Is Being Routed By Its Benchmark Index

Fidelity's Magellan mutual fund was once that most admired mutual fund in the industry from the mid-1970s until the early 1990s. The legendary fund manager Peter Lynch steered the fund to whopping 29% annual returns during his years at the helm between 1977 and 1990. A $10,000 investment in Magellan in 1977 would have grown to $288,000 by 1990, as discussed in this article.

Unfortunately, Magellan's performance has lagged for the past 10+ years due to bad investments by its managers. Its huge size has also been a hindrance, as enormous growth-oriented mutual funds have difficulty closing positions in growth stocks without adversely affecting the price of stocks it is selling.

According to this recent article in Fortune magazine, Magellan is currently mired in its second-worst performance slump relative to the S&P 500 index in 30 years.

Friday, October 27, 2006

"Revolt of the Fairly Rich"

Fortune magazine has an interesting article on its websiste regarding entitled "Revolt of the Fairly Rich." This article exposes alleged economic resentment between between people at the lower end of the upper 1% of the weathiest people in the U.S. versus those at the high end of the upper 1%.

According to Fortune some of the "lower uppers" are doctors, accountants, engineers, and lawyers, and these successful people work very hard are are somewhat jealous of the "high uppers" who are perceived as sometimes making 10 times as much money without working 10 times as hard as do they.

I personally think that this alleged resentment is overblown. It is true that some of those professionals who are lower uppers are jealous to a certain extent that people at the high end make so much more money. However, I don't see an impending revolt anytime soon. Many professionals are in highly competitive and stressful businesses/industries and they often feel as though they are not being paid what they are worth. Even though they might not be making as much as the person next door, they certainly must realize that in the grand scheme of things they do have it pretty good.

Thursday, October 26, 2006

LSI Logic Finally Delivers!

LSI Logic (symbol: LSI), an integrated circuit and data storage chip designer, is the only individual stock I own in my non-IRA portfolio. LSI, like all semiconductor stocks, is extremely volatile and has stretches of time where it has risen or fallen by 30% in a 2-3 month time span.

I accumulated my LSI position over a period of 2 years, buying shares periodically on dips between October 2002 and July 2004. My average cost basis is $6/share and I have been waiting for LSI to break above $12 so that I can sell my shares and realize a 100+% gain.

LSI closed at $8 on the last trading day in December 2005. It rose to $11.81 on March 31st, but has floundered since then, dropping down below $8, with its lowest close occurring on August 25th, when it closed at $7.46/share.

LSI reported its earnings for its 3rd fiscal quarter yesterday. I expected them to be lackluster, but I was pleasantly surprised. The Street was expecting earnings of 12 cents per share, and LSI reported non-GAAP earnings of 16 cents per share. LSI also provided decent guidance for the upcoming quarter. Wall Street took notice and has bid LSI higher by about 16% today, up to $9.69/share.

Wednesday, October 25, 2006

Add My Financeandinvestments Blog to My Yahoo!

I was recently playing around on My Yahoo! and I discovered a way to link content from my blog to my My Yahoo! page so that recent posts are listed along with the standard categorized news. I am no HTML expert, but I think that this was relatively simple to do.

If you want to add Financeandinvestments.blogspot.com to your My Yahoo! page so that you can see my most recent posts about stocks and personal finance, all you need to do is click on the "Add Content" link at the bottom of your My Yahoo! page. On the next page you will need to click on the link entitled "Add RSS by URL" to the right of the displayed "Find Content" box. On the subsequent page, type this URL into the box:
http://financeandinvestments.blogspot.com/rss.xml

Finally, you can click on the link to return to My Yahoo! Once back on the My Yahoo! page, I clicked the "edit" button on the tab for my my blog. I personalized the tab so that the 3 most recent posts are always linked to my My Yahoo! page, regardless of when those posts were created.

Tuesday, October 24, 2006

I'm Still Saving U.S. Nickel Coins

Back on April 6, 2006 I wrote that I was saving all of the U.S. nickels I acquire in change because the melt value of nickels was about 4.24936 cents, or 84.98% of the 5-cent face value ofthe U.S. nickel coin. Almost all U.S. nickel coins made between 1938 and 2006 contain 75% copper and 25% nickel (the exception was during 1942-1945 when almost all nickels contained silver and manganese instead of nickel). At the time of my previous post, nickel was trading at $7.7564 per pound and copper was trading at $2.6112 per pound.

It's a good thing that I've been saving nickels because the value of nickel and copper has soared since April. One pound of nickel is now worth $15.4909, nearly twice what it was a mere 6 months ago. Copper has risen a slightly less impressive 31%, with one pound of copper now trading for $3.4302 per pound. The melt value of U.S. nickel coins is now about 7.10471 cents, or 142.09% of its 5 cent face value. The melt value of U.S. nickel coins has therefore risen about 67% since April.

If the value of copper and nickel remains strong, it's only a matter of time until everyone starts hoarding U.S. nickel coins, just like the U.S. population did in the 1960 when quarters used to be made of silver and the price of silver rose so much that the value of the silver in quarters exceeded the 25-cent face value of the quarters. Accordingly, I continue to recommend that people saved their nickels.

FYI, numismatic news has a great article about hording coins.

Friday, October 13, 2006

Interesting Website With Information About Dow Jones Indices

I have discovered a Dow Jones Index website that contains data for various Dow Jones indices. I especially enjoy looking at the current fundamental data for the Dow Jones 30 index. The website also lists miscellaneous trivia such as the best and worst one-day changes in the Dow Jones Industrial Average, the best and worst one-year returns, and the dates upon which certain milestones occurred (such as the day the Dow Jones Industrial Average closed above 10,000 for the first time).

Monday, October 02, 2006

September 2006 Returns For My Model Long-Term Portfolio

My Hypothetical Model Portfolio had decent returns during the month of September. As of the market close on September 29, 2006, the Hypothetical Model Portfolio* increased in value by $1272.34, or about 1.18% during the month of September. The Hypothetical Model Portfolio is now up $9395.02 in 2006, a gain of 9.40%, as shown on the table below (click for a larger image of the table).

The portfolio was strong throughout the month. Tech stocks led the way for the second straight moneth, with the Nasdaq 100 ETF (QQQQ) rising 4.58%. The second biggest winner (on a percentage basis) was the S&P 500 Financial components ETF (XLF), which appreciated by 3.56%. Large cap stocks also performed very well - the Vanguard S&P 500 Index fund (VFINX) rose about 2.56%.

Small caps and international stocks were laggards during September, possibly due to a stronger U.S. dollar. The Templeton Russia closed-end fund (TRF) and
the iShares Emerging Markets ETF (EEM) both posted negative returns, falling about 4.00% and 0.87%, respectively. Other dogs include the Vanguard Developed Markets Index fund (VDMIX), the Vanguard Small Cap Value Index (VISVX), and the Vanguard Small Cap Index (NAESX) which rose just 0.17%, 0.88%, and 0.90%, respectively.

One of the holdings in my Hypothetical Model Portfolio, VFINX, paid dividends during Septmember. As I mentioned in a previous post, the dividends from mutual fund holdings are reinvested, but the dividends from ETFs or the closed end fund (i.e., the Templeton Russia closed-end fund (TRF)) are not reinvested- they will accumulate as "CASH" on the performance table below. VFINX paid a dividend of $0.52/share (a total of $100.40) which was reinvested on September 22 to purchase an additional 0.829 shares at a price of $121.08/share.

I was glad to see decent returns in August. Hopefully stocks will perform well during the 4th quarter of 2006 so that my Hypothetical Model Portfolio will end 2006 up 10-15%.

*The Hypothetical Model Portfolio was hypothetically created with an investment of $100,000 with investments made as of the closing values on December 30, 2005. The reason why the total cost in the chart is greater than $100,000 is because the total cost accounts for the value of dividends reinvested into the mutual funds in the portfolio.

Friday, September 22, 2006

The SPDR Financial components (XLF) Is Paying A Quarterly Dividend On October 31, 2006

The SPDR Financial components (symbol: XLF) is paying a quarterly dividend of $0.1938 per share on October 31, 2006. It is often difficult to find much information about upcoming dividends for XLF. However, I was able to discover the relevant information by viewing the ETF information available at Amex.com.

Monday, September 18, 2006

August 2006 Returns For My Model Long-Term Portfolio

My Hypothetical Model Portfolio experienced its strongest month since April. As of the market close on August 31, 2006, the Hypothetical Model Portfolio* increased in value by $2492.74, or about 2.36% during the month of August. The Hypothetical Model Portfolio is now up $8122.67 in 2006, a gain of 8.12%, as shown on the table below (click for a larger image of the table).

The portfolio rallied toward the end of the month to show the impressive August returns. Tech stocks led the way, with the Nasdaq 100 ETF (QQQQ) rising 4.77%. The second biggest winner (on a percentage basis) was the Templeton Russia closed-end fund (TRF), which increased in value by about 4.03%, bringing its total return for 2006 through August 31st to an impressive 38.95%. Other solid performers included the Vanguard Developed Markets Index fund (VDMIX) and the Vanguard S&P 500 Index fund (VFINX), which returned about 2.64% and 2.36%, respectively, during August.

Dividend-paying stocks and the emerging markets were the laggards last month. The iShares Dow Jones U.S. Select Dividend Index Fund (DVY), the S&P 500 Financial components ETF (XLF), and the iShares Emerging Markets ETF (EEM) had sub-par returns of about 1.14%, 1.18%, and 1.58%, respectively. I suppose this was to be expected, as these three ETFs were the top performers in July.

I was glad to see QQQQ finally show some decent returns in August. It was bound to happen sooner or later. QQQQ is still down about 3.75% on the year, but I suspect we'll see tech stocks rally through the last quarter of 2006.

*The Hypothetical Model Portfolio was hypothetically created with an investment of $100,000 with investments made as of the closing values on December 30, 2005. The reason why the total cost in the chart is greater than $100,000 is because the total cost accounts for the value of dividends reinvested into the mutual funds in the portfolio.

Thursday, August 31, 2006

Historical Dividends for the S&P 500

Dividends are crucial to any long-term investor's portfolio. During extended bear markets they often provide the only positive returns to the investor. I have often wondered about the long-term historical dividend increases of various stock indices, such as the S&P 500 index, but have had difficulty finding information going back more than 20 years or so. Luckily, however, I discovered an article concerning historical dividend growth and stock valuations between 1871 and 2003. This article is entitled "Dividends and Stock Valuation: A Study From the Nineteenth to the Twenty-First Century".

This article provides various data which it purports to relate to dividends and valuations for the S&P 500 dating back to 1871.* As shown in the chart below, dividends increased an average of 3.23% per year between 1871 and 2003. However, this average increase was not uniform. The chart below divides the dividend increases into three periods: (a) 1871-1913, (b) 1914-1945, and (c) 1946-2003. Between 1871 and 1913, dividends increased an average of 1.51% annually, between 1914 and 1945 they increased about 1.00% annually, and between 1946 and 2003 they increased an average of 5.74% annually. The dividend increases have accelerated further since 2003, as discussed in a previous post.

The annual dividend increases since 1946 have been very impressive. This highlights the reason why I am a strong believer that dividend-paying stocks should comprise a portion of every investor's portfolio. In fact, I believe that dividend-paying stocks are far more attractive than bonds for young investors (e.g., investors under 35 or 40 who will likely participate in the workforce for 20+ more years) for several reasons.

First, dividend income is generally taxable at a maximum rate of 15% a year as opposed to bond payouts which are generally taxed as ordinary income (i.e., at a tax rate of up to 35% for an individual). Second, dividend-paying stocks offer a great potential for capital gains not provided by bonds. For example, in the event that the earnings for the companies paying dividends keep increasing, there is a likelihood that their associated stock prices will also rise and that their dividend payouts will increase accordingly. Bonds, on the other hand, pay the same interest payout amounts year-after-year.

Finally, dividend-paying stocks provide some protection against inflation that bonds necessarily cannot provide. The prevailing view holds that as inflation heats up companies raise prices and the revenue from the inflated prices is reflected as increased company earnings. As earnings increase, the corresponding stock prices and dividends generally increase accordingly, as discussed above. However, during such inflationary periods, bonds become less valuable. For example, a 5% payout may be attractive when inflation is running at 1% per year, but are far less attractive when inflation accelerates to 6% per year.


*This data cannot be correct, however, as the S&P 500 index was only created in or around 1923. I presume that the data prior to 1923 must have come from a similar index of large-cap stocks.

Thursday, August 03, 2006

July Returns For My Model Long-Term Portfolio

My Hypothetical Model Portfolio was slightly down during July. As of the market close on July 31, 2006, the Hypothetical Model Portfolio* decreased in value by $598.54, or about 0.56% during the month of July. The Hypothetical Model Portfolio is up $5629.93 in 2006, a gain of 5.63%, as shown on the table below (click for a larger image of the table).

The portfolio was down substantially earlier in July before recovering strongly near the end of the month. This choppy performance is similar to what happened during June 2006. Tech stocks continued to struggle during July, resulting in a drop of 4.24% in the Nasdaq 100 ETF (QQQQ). The second biggest losss (on a percentage basis) was the Vanguard Small Cap Index (NAESX) which dropped 3.31% during July. The other big losers were the Vanguard Midcap Index (VIMSX) which fell 2.28% and the Templeton Russia closed-end fund (TRF) which dropped 2.24%.

On a positive note, large caps and dividend paying stocks performed well in July. The iShares Dow Jones U.S. Select Dividend Index Fund (DVY) and the S&P 500 Financial components ETF (XLF) returned 3.31% and 3.06%, respectively. Other top performers include the Emerging Markets ETF (EEM) and the Vanguard Developed Markets Index (VDMIX), which returned 2.34% and 1.16%, respectively.

Two of the holdings in my Hypothetical Model Portfolio paid dividends in July. As I mentioned in a previous post, the dividends from mutual fund holdings are reinvested, but the dividends from ETFs or the closed end fund (i.e., the Templeton Russia closed-end fund (TRF)) are not reinvested- they will accumulate as "CASH" on the performance table below.

XLF paid a dividend of $0.187 on July 31 (a total of $14.77) which was moved to "CASH" on the table shown below. QQQQ paid a dividend of $0.0257/share on July 31 (a total of $3.96) that was also moved to "CASH" on the table below. Accordingly, the value of accumulated and uninvested distributions is now up to $463.66.

The Hypothetical Model Portfolio's performance was not bad during July. The main thing holding it back was the poor return of tech stocks which dragged down QQQQ. Tech stocks have been out of favor with investors for 6+ years after so many got burned holding them when the bubble burst in 2000. Eventually investors will warm to tech again. I don't know when that will happen, but rest assured that it will eventually happen. That is why I included QQQQ in my Hypothetical Model Portfolio. I still firmly believe that this portfolio will outperform the major stock market averages over time.

*The Hypothetical Model Portfolio was hypothetically created with an investment of $100,000 with investments made as of the closing values on December 30, 2005. The reason why the total cost in the chart is greater than $100,000 is because the total cost accounts for the value of dividends reinvested into the mutual funds in the portfolio.

Wednesday, July 19, 2006

Emigrant Direct Is Raising Its Money Market Interest Rate to 5.15% On July 28

Today I received a letter from Emigrant Direct which contains a secure 10 digit access code for a new Emigrantdirect.com website. The letter also indicates that Emigrant Direct is raising its money market interest rate to 5.15% on July 28, 2006. The new rate will be 0.80% higher than the relatively platry 4.35% currently offered by INGDirect.

Friday, July 14, 2006

Attacks on Dollar-Cost Averaging Investment Strategies Are Unjustified

I’ve recently read a number of articles badmouthing a dollar-cost averaging investment strategy (i.e., investing a certain amount of money in stocks at regular intervals). Consider, for example, this article in USA Today.

The author mentions that if one had invested $100 per month in the Vanguard 500 Index Fund over the past decade, one would currently own shares worth $15,437, a gain of $3,437, or 31.3%, over the total invested amount of $12,000. The author contrasts this with an investment of $12,000 made exactly 10 years ago which would be worth about $26,640, a gain of 122%. The author claims that the disparity between the investor’s actual return of 31.3% and the total 122% return of the S&P 500 over the past 10 years shows that dollar-cost averaging doesn’t always work.

I wholeheartedly disagree with the author’s conclusion. First, the hypothetical investor discussed in the market desires to invest money periodically in the market and probably would not have the entire $12,000 to invest all at one time 10 years ago.

Second, because the dollar-cost averaged shares are purchased over a period of 10 years, the average share of stock would have been purchased only 5 years ago (halfway through the time period), so it’s not really fair to compare that with money invested a full 10 years ago. If the author wanted to make a fair comparison, he would compare the dollar-cost averaged shares purchased versus a lump-sum purchase make exactly 5 years ago, so that both investments have the same average investment time period. Seeing as how the stocks experienced a strong decline in 2001 and 2002, I would bet that the dollar-cost averaged shares would come out ahead in that comparison (with less risk!).

Third, one of the great benefits of dollar-cost averaging is that it spreads risk out over time. That is, instead of trying to guess where the “bottom” of the market is and invest all of one’s money at that time, the risk of over-paying for the stock can be spread out over an extended period of time. Several theories of equity valuation acknowledge that short-term inefficiencies exist in the market and that stocks often trade at a premium (or discount) to their true intrinsic value. However, there are few investors, if any, who have the ability to accurately determine the true intrinsic value of stocks at a particular time. By spreading the money to be invested in stocks over a long time period, the investor reduces his chances of overpaying, on average, for the stocks.

Fourth, by dollar-cost averaging with index funds the investor can avoid having to spend a lot of time/money researching stocks to determine which to purchase. Instead, the investor can simply determine the long-term historical returns/trends for stocks and invest accordingly. For example, I invest according to my Hypothetical Model Portfolio and expect it perform well over time.

Friday, July 07, 2006

June Returns For My Model Long-Term Portfolio

The performance of my Hypothetical Model Portfolio was flat during June. As of the market close on June 30, 2006, the Hypothetical Model Portfolio* increased in value by $42.77, or about 0.04% during June. The Hypothetical Model Portfolio is up $6228.47in 2006, a gain of 6.23%, as shown on the table below (click for a larger image of the table).

The portfolio was down substantially (bottoming near a loss of about $6,000) through most of the first half of June before recovering strongly near the end of the month to finish flat.
The Templeton Russia closed-end fund (TRF) continued to struggle, finishing with a loss of 1.53% for the month after being down about 30% for the month as of June 13th. The second-worst performer was the SPDR Financial components (XLF) which fell 1.22%.

On a positive note, my small cap holdings performed well. The Vanguard Small Cap Value Index (VISVX) was my top performer, returning 1.09% in June. The Vanguard Small Cap Index mutual fund (NAESX) was also positive, returning 0.20%. The Emerging Markets ETF (EEM) was another positive performer, recovering from a disastrous May by returning a respectable a respectable 0.21% in June. The iShares Dow Jones U.S. Select Dividend Index Fund (DVY) also performed well, returning 0.83% during June.

Four of the holdings in my Hypothetical Model Portfolio paid dividends in June. As I mentioned in a previous post, the dividends from mutual fund holdings are reinvested, but the dividends from ETFs or the closed end fund (i.e., the Templeton Russia closed-end fund (TRF)) are not reinvested- they will accumulate as "CASH" on the performance table below. The reason I am doing this is because the index mutual funds in this portfolio do not charge a transaction fee for reinvesting dividends. To reinvent dividends for any of the ETFs or TRF, on the other hand, would cause me to incur transaction fees for the trading commissions.

The Vanguard S&P 500 index fund (VFINX) paid a dividend of $0.49/share (a total of $94.22) which was reinvested on June 23 to purchase an additional 0.805 shares at a price of $116.99/share. DVY paid a dividend of $0.56501 on June 28 (a total of $45.20) which was moved to "CASH" on the table shown below. TRF paid a long-term distribution of $5.2476/share on June 19 (a total of $335.85) that was also moved to "CASH" on the table below.

The economy continues to hum along despite the FED interest rate increases. I suspect that the FED will raise rates a couple more times and then be done with it. Hopefully the market will finally surge at that time.

*The Hypothetical Model Portfolio was hypothetically created with an investment of $100,000 with investments made as of the closing values on December 30, 2005. The reason why the total cost in the chart is greater than $100,000 is because the total cost accounts for the value of dividends reinvested into the mutual funds in the portfolio.

Thursday, June 29, 2006

Emigrant Direct Raises Its Money Market Interest Rate to 4.80%

I just saw an online advertisment for Emigrant Direct which indicates that they have raised their money market interest rate to 4.80%. I'm not sure if they raised their money market interest rate today, but it must have happened sometime within the past few days. Emigrant Direct now pays more than half a percent more than INGDirect, which currently pays a paltry 4.25%.

Tuesday, June 27, 2006

Robert Kiyosaki Has Written Another Flimsy Article For Yahoo Finance

Robert Kiyosaki has once again written an article for his Yahoo Finance column that has gotten me all riled up. (See my previous post - "Robert Kiyosaki Is A Blowhard.") This one is entitled “Why Mutual Funds Are Lousy Long-Term Investments.”

He basically attempts to argue that mutual funds are wastes of money because of the fees they charge. He borrows quite a bit from an interview given by Vanguard founder John Bogle in which Bogle mentioned that mutual funds charging high fees are doing a disservice to most investors because the investors take 100% of the risk, put up 100% of the amount to be invested, but over time make quite a bit of money for the companies offering the mutual funds.

That’s fine and I do not disagree with that allegation. Bogle thinks that actively managed funs generally charge too much and that most investors would instead be better served investing in index-tracking funds. I also agree with Bogle on that point.

However, after spending about half of his “article” directly quoting Bogle, Kiyosaki mentions that he dislikes index funds because “[m]ost index funds think a 10 percent to 25 percent return is a good rate.” Kiyosaki also writes “[a]ctive investors can regularly beat those gains, especially if they stay away from traditional investments such as savings, stocks, bonds, and index and mutual funds.”

I don’t know what Kiyosaki is talking about, because as far as I know, there are only a handful of top money managers capable of providing consistent returns greater than 10-25% annually, and Kiyosaki is not one of them. The vast majority of investors (including yours truly) would be very happy to own a portfolio of mutual funds returning 10-25% per year.

Kiyosaki has a tendency to trump certain investing styles after they have already come into fashion and then mention that he has been investing in them and recommending them for years without any corresponding documentation. It is always the same with this guy – he’s a salesman, and based on his book sales he’s a good salesman at that, but he’s not the big-time investor he attempts to make himself out to be.

Although he has previously stated that the “rich dad” discussed in his books is a real person with was his financial mentor when growing up, he has never providing that individual’s name, and nobody has ever been able to find even a scintilla of evidence that this alleged “rich dad” even exists outside of Kioysaki’s mind.

Also, I know that he’s been trumpeting precious metals and energy stocks lately, but was he really buying them en mass in 2002 when money managers shunned them and they sat at historically low valuations? I certainly doubt it.

His column and books may be entertaining but take everything he writes with a grain of salt, as 90% of the personal stories in them are almost certainly fabricated, as discussed on this website.

The Nasdaq 100 ETF (QQQQ) Is Paying A Quarterly Dividend On July 31, 2006

The Nasdaq 100 ETF (symbol: QQQQ) is paying a dividend of $0.0257 per share on July 31, 2006. This dividend is being paid to shareholders of record as of June 20, 2006.

As with QQQQ's previous distribution in April 2006, it took me awhile to find the actual distribution date of this dividend. Yahoo Finance had indicated that the dividend was declared on June 16, 2006, but it did not list when the payout date would be. I was finally able to determine the payout date after some searching on Google and finding this article.

Friday, June 16, 2006

The Volatility of the Russian Stock Market

The Russian stock market has taken it on the chin over the past six weeks or so. For example, the Russia RTX stock index (see the chart below) has fallen from an intra-day high of 2955 on May 10 to a close of 2105 as of today. That is a drop of 28.7%!

However, the index is still up substantially over the past 52 weeks. It closed at 1057 on June 16, 2005. That is a gain of 1048 points, or 99%. It amazes me that the stock market index for country as big as Russia can be this volatile.

I personally will continue to invest in Russia stocks via the Templeton Russia and Eastern European fund (symbol: TRF). However, I will continue to limit TRF to no more than about 3% of my long-term portfolio.

Monday, June 05, 2006

May Returns For My Model Long-Term Portfolio

My Hypothetical Model Portfolio performed very poorly in May. As of the market close on May 30, 2006, the Hypothetical Model Portfolio* dropped $5,495, or 4.92% during May. However, the Hypothetical Model Portfolio is still up $6185.70 in 2006, a gain of 6.19%, as shown on the table below (click for a larger image of the table).

Every one of the holdings went down, as May was a horrible month for stock market investors across the board. Foreign holdings were my worst performers in April, with the Templeton Russia closed-end fund (TRF) plummeting 14.01% and the Emerging Markets ETF (EEM) dropping 11.14%. Despite these huge drops, TRF and EEM are still up 38.91% and 6.11%, respectively, in 2006. My two best performers were the iShares Dow Jones U.S. Select Dividend Index Fund (DVY) and Vanguard S&P 500 index fund (VFINX) which dropped 1.41% and 2.90%, respectively.

I suspect that the ugly May results do not represent anything other than a correction. The U.S. economy is still humming along and the FED will probably stop raising rates sometime soon. The Hypothetical Model Portfolio is still on pace for a solid 15.5% total return in 2006 even after the May correction.

*The Hypothetical Model Portfolio was hypothetically created with an investment of $100,000 with investments made as of the closing values on December 30, 2005. The reason why the total cost in the chart is greater than $100,000 is because the total cost accounts for the value of dividends reinvested into the mutual funds in the portfolio.

Wednesday, May 31, 2006

Franklin Templeton Posts The Premium/Discount For The Templeton Russia Fund (TRF) On Its Website

Want to find out the premium (or rare discount) for the Templeton Russia and Eastern Europe fund (symbol: TRF)? Franklin Templeton posts the current premium on its website every few days or so. I just checked and as of May 26, 2006, the premium for TRF was a whopping 33.22%! It's concerning that the premium is that high, as a sharp pullback in the Russian stock market could send TRF plummeting.

Friday, May 26, 2006

Emigrant Direct Raises Its Money Market Interest Rate to 4.65%

I just saw an online advertisment for Emigrant Direct which indicates that they have raised their money market interest rate to 4.65%. As far as I can tell, this rate change was implemented today. Emigrant Direct now pays half a percent more than INGDirect, which currently pays a paltry 4.15%.

Tuesday, May 23, 2006

BusinessWeek Has An Article About The Recent Sharp Pullback In Emerging Markets

BusinessWeek has published an article entitled "Behind Emerging Markets' Malaise" on their website about the sharp pullback over the past two weeks in the Emerging Markets sector. BusinessWeek interviewed Alka Banerjee, who focuses on international markets as vice-president of global index management at Standard & Poor's. Banerjee seems to be of the opinion that this is just a temporary, but necessary, pullback in the Emerging Markets and that Emerging Markets will continue to do well unless the price of oil collapses.

Monday, May 15, 2006

The NAV Premium For The Templeton Russia Fund (TRF) is Plummeting!

The Templeton Russia and Eastern Europe closed-end fund (symbol: TRF) has dropped like a rock over the past week. TRF has dropped from a closing price of $93.81 on May 9th to a closing price of $72.50 as of today, May 15th. That is a drop of 22.7% in just four days of trading. Meanwhile, the Russia stock market benchmark RTX index has dropped around 9% over the same time period.

The reason why TRF has fallen so much more than the RTX index is because its closed-end fund premium was very high as of last week. According to ETFconnect, TRF was trading at a premium of about 37% above its net asset value (NAV) on May 9th, and that premium has dropped all the way down to about 9% as of today, May 15th.

Most closed-end funds trade at discounts to their underlying NAV. However, some of the best performers do occassionally trade at large premiums. Unfortunately, these premiums can quickly evaporate when the going gets tough and momentum investors start to jump ship.

Wednesday, May 10, 2006

Everbank Provides An Easy Way To Speculate In Foreign Currency And Precious Metals

I just discovered Everbank, a bank that allows investors to easily invest in foreign currency and precious metals. They offer CDs and deposit accounts in foreign currencies that will appreciate in value if the U.S. dollar depreciates. Everbank also offers a "DollarBull" CD that will increase in value if the U.S. dollar rises against selected foreign currencies.

One of their most interesting offerings is their "MarketSafe" Gold Bullion CD. This is a great offer because if gold rises over the five year holding period, the investor will get back the original principal plus the value of the increase in the price of gold. But the investor is also protected if gold falls in price and will still get back the original principal in the event of a decline in the price of gold.

Friday, May 05, 2006

Moneychimp.com Has An Interesting Article About Small Cap Stocks

I recently discovered an interesting article about small cap stocks and their returns relative to large cap stocks over at Moneychimp.com. The article also includes an online calculator that allows one to enter a range of years between 1927 and 2005 and view the annualized returns for small cap and large cap growth and value stocks. The calculator also showns nominal and inflation-adjusted returns. As I have previously written, small cap value stocks trounce large cap growth stocks over time and this article provides further evidence of the disparity in returns.

Thursday, May 04, 2006

Free Online Access To The Wall Street Journal's Website, WSJ.com, Through May 10

I just discovered that the Wall Street Journal is providing free access to its online website, WSJ.com, through May 10th. I wish I had discovered this promotion a few days ago because apparently they have been providing free access since Monday, May 1st. The Wall Street Journal is, in my opinion, the best financial-related newspaper in the U.S. and I highly recommend that everyone check out the WSJ.com website.

Sunday, April 30, 2006

April Returns For My Model Long-Term Portfolio

My Hypothetical Model Portfolio had another solid month in April. As of the market close on April 28, 2006, the Hypothetical Model Portfolio* was up $2,749.72, or 2.52% during March. The Hypothetical Model Portfolio is now up $11680 in 2006, a gain of 11.68%, as shown on the table below (click for a larger image of the table).

Foreign holdings were my top performers in April, with the Templeton Russia closed-end fund (TRF) leading the way with a strong 16.16% return. The Emerging Markets ETF (EEM) was the second-best performer with a 6.52% return, and the Vanguard Developed Markets index fund (VDMIX) came in third place with a return of 4.84%. Through the first four months of 2006, TRF is already up a whopping 61.55%, EEM is up 19.42%, and VDMIX is up 14.59%! I expect foreign equities to continue to perform well given that the U.S. Dollar is bound to fall relative to foreign currencies due to the United States’ massive trade deficit. Also, TRF and EEM are invested heavily in countries that are huge net exporters of oil and raw materials and will continue to benefit from the current commodities boom.

Other solid April performers include the SPDR Financial components (XLF) which returned 3.80% and the iShares Dow Jones U.S. Select Dividend Index ETF fund which returned 2.07%. Both of these invest heavily in financial stocks. These probably did well in April after the FED indicated it is close to halting its interest rate hikes.

Vanguard Index 500 mutual fund (VFINX) and the Vanguard Midcap Index mutual fund (VIMSX) were up just over 1% in April, and the small cap holdings (i.e., Vanguard Small Cap Index mutual fund (NAESX) and Vanguard Small Cap Value Index (VISVX)) were barely changed in April. The only holding that fell in value was the Nasdaq 100 ETF (QQQQ), which fell about .12%.

Two of the holdings in my Hypothetical Model Portfolio paid dividends in March. As I mentioned in a previous post, the dividends from mutual fund holdings are reinvested, but the dividends from ETFs or a closed end fund (i.e., TRF) are not reinvested- they will accumulate as "CASH" on the performance table below. The reason I am doing this is because the index mutual funds in this portfolio do not charge a transaction fee for reinvesting dividends. To reinvent dividends for any of the ETFs or TRF, on the other hand, would cause me to incur transaction fees for the trading commissions.

XLF paid a dividend of $0.177 on April 28 (a total of $13.98), and QQQQ paid a dividend of $0.029 on April 28 (a total of $4.47), both of which were moved to "CASH" on the table shown below.

*The Hypothetical Model Portfolio was hypothetically created with an investment of $100,000 with investments made as of the closing values on December 30, 2005. The reason why the total cost in the chart is greater than $100,000 is because the total cost accounts for the value of dividends reinvested into the mutual funds in the portfolio.

Friday, April 28, 2006

The iShares Silver ETF Was Launched Today

The first silver-based ETF was launched today by Barclays Global Investors. The name of the ETF is the iShares Silver Trust and its ticker symbol is SLV. Each share of SLV will initially represent 10 ounces of silver and opened at $129/share on the AMEX today. For almost all investors, SLV provides the cheapest means of buying and selling silver.

TheStreet.Com article about SLV

Thursday, April 27, 2006

Some ETFs Are Very Difficult To Sell Short Due To A Shortage Of Available Shares

Smartmoney.com has an interesting article about shorting ETFs. The focus of the article is that despite the ETF industry's claims that one of the major benefits of ETFs is their ability to be sold short, many brokers are unable to actually sell shares of some of the ETFs short due to a shortage of available shares.

As I mentioned in a previous post, to sell shares short, one's broker has to borrow the shares from some other party who has a long position on the shares (usually another broker). Unfortunately, if no shares are available for borrowing, then it is not be possible to sell short any shares. This is disconcerting because on of the strategies I intend to implement in the future is a long-short arbitrage strategy (I have already tested such a strategy, as discussed here and here) where I sell short shares of a first ETF and use the proceeds of the short sale to purchase a long posiiton of a second, and different, ETF I think will outperform the first ETF.

Monday, April 24, 2006

Stock Market Styles Are Very Cyclical

NYC Money has a good article posted on her blog regarding large caps and why the financial industry keeps promoting them. She postulates that the financial industry including writers for financial media really have no idea how to make money in the stock market and so they thereofre just keep repeating the same "advice" everyone else has been giving.

I agree with what she wrote and some of the comments posted there. If money managers and financial writers really wanted investors to achieve the highest returns over the long haul, they would tell them to invest in value and small caps, placing a large amount in small cap value stocks. If one had invested $10,000 in small cap value stocks in 1926 and held them and re-invested the dividends, that investment would have been worth about $1 billion by the end of 2004, as discussed in a previous post I wrote about small-cap outperformance.

She mentioned she doing well in foreign equities and I admit that I myself have been investing in foreign stocks over the past year and have done well. However, if there's one thing I've learned by following the markets and investing for the last 10+ years it is that the stock market tends to be very cyclical. Investing styles tend to do in and out of favor. For most of the 90s, large caps (especially large cap growth) performed very well and may have provided better returns than small caps or foreign stocks. Small caps and mid caps have substantially outperformed large caps since 2000. The tide will eventually turn again, although I don't really know when that will be.

Foreign stocks and emerging markets performed very poorly in the late 80s and during most of the 90s. The problem with a lot of the emerging markets is that the political situations in those countries are frequently unstable. Investors in emerging markets took a bath, for example, (a) in the mid-90s when Mexico's currency collapsed, (b) in the late 90s when the Asian currency crises occurred and Russia devalued its currency, and (c) in or around 2001 when Argentina defaulted on billions of dollars in international loans and its currency collapsed.

The stock markets of foreign developed markets (e.g., in high GDP countries such as Japan or Western Europe) also tended to trail the large cap US stocks in the 90s due to the Japanese stock market crash, although they have certainly provided better returns than U.S. large caps over the past 6 years.

I think that a well-diversified portfolio, such as my Hypothetical Long-Term Portfolio, should include large caps, mid caps, small caps, and foreign developed and emerging markets stocks. In a previous post I posted a useful chart that illustrates the annual returns for various investment styles between 1986 and 2005.

Thursday, April 20, 2006

The Silver Market Is In A Free-Fall Today

I just checked the price of silver and was shocked to see that it fell over 14% today, from $14.53 per ounce all the way down to $12.41 per ounce. Presumably, speculators are locking in gains from silver's YTD 63% gain as of yesterday. I don't know what will happen to silver in the short-term, but it would not surprise me to see its ascent continue later in 2006. The silver market kind of reminds me of the Nasdaq in the late 90s when the Nasdaq Composite Index experienced tremendous volatility and shot up in value to levels that could not be justified by the underlying fundamentals.

Thursday, April 13, 2006

Website For Performing Historical U.S. Dollar Value Comparisons

I have discovered a great website entitled "Economic History Services" that allows one to see just how much the value of the U.S. dollar has eroded over time. You can input a dollar value between 1790 and 2004 and out how much it was worth in a different year. Several methods are used to determine the relative valuation, including CPI, GDP deflator, Unskilled wage, GDP per capital, and (relative share of) GDP.

Monday, April 10, 2006

Great Artilce About the Lagging Performance of Large Cap Stocks in This Week's Issue of BusinessWeek

BusinessWeek has a great article entitled "Blue Chip Blues" about the lagging performance of large cap stocks relative to their small cap and international peers. The author discussed why large cap stocks have performed so poorly this decade and why their underperformance might continue on into the future.

I found this article to be interesting. I personally have a very difficult time believing that large cap stocks are no longer worthy of my investment dollars. Investing styles tend to be very cyclical. Large cap stocks are not currently viewed as favorably as small cap or mid-cap stocks. However, during the mid-late 90s the exact opposite was true. I believe that the tide will eventually turn and large caps will start to outperform again. Over the long, long run (e.g., a 20-30 time frame), I believe small cap stocks will outperform. However, over a 5- or 10-year time frame, I do believe that it is possible for large cap stocks to generate better returns than small caps. I guess we'll all have to wait and see what happens.

Thursday, April 06, 2006

Since Commodities Are Soaring, I am Saving Nickels and Pre-1982 Pennies

The price of copper has continued to soar. As of the commodity market close today, one pound of copper was trading for $2.6112. The price of nickel and zinc has also been soaring - as of today's market close, one pound of zinc was trading for $1.2909 and one pound of nickel was trading for $7.7564.

As I mentioned in a previous post, I have been saving my pre-1982 pennies for several months now because pre-1982 pennies contained 95% copper and copper has risen so much in value. A pre-1982 penny now contains about 1.745 cents worth of copper in it. That is, the copper in a pre-1982 penny is worth 74.5% more than the face value of a penny.

Nickels also contain a large percentage of copper. Almost all nickels made between 1938 and 2006 contain 75% copper and 25% nickel (the exception was during 1942-1945 when almost all nickels contained silver and manganese instead of nickel). The current commodity value of the metals in a nickel is about 4.24936 cents, or 84.98% of the 5-cent face value of a nickel. Given how well commodities have been performing, it seems likely that the prices of copper and nickel will continue to rise to the point at which the metal in the nickel are worth more than the face value of the nickel. I have therefore been hording the nickels I get in change. Also, because the design on all nickels made from 2006 on into the future is different than the design on older nickels, I believe that nickels from 2005 and earlier will also eventually have a numismatic value exceeding five cents, regardless of the metal value contained within them.

Here is an image captured from coinflation.com showing the current intrinsic values of various coins in circulation based on the value of the metals contained within those coins:

Wednesday, April 05, 2006

March Returns For My Model Long-Term Portfolio

My Hypothetical Model Portfolio performed very well in March. As of the market close on March 31, 2006, the Hypothetical Model Portfolio was up $2,718.39, or 2.56% during March. The Hypothetical Model Portfolio is now up $8930 in 2006, a gain of 8.93%, as shown on the table below (click for a larger image of the table).

Small caps were my best performers, with the Vanguard Small Cap index fund (NAESX) leading the gains with a rise of 4.18%, and the Vanguard Small Cap Value index fund (VISVX) rising 3.58%. My diversified international index fund, the Vanguard Developed Markets index fund (VDMIX) also performed well, rising 3.53%.

However, March was not a particularly great month for the holdings paying substantial dividends. As shown in the table below, iShares Dow Jones U.S. Select Dividend Index Fund (DVY) lost 0.11% in March, and the SPDR financial component index ETF gained only 0.74%. Financials are a major component of DVY, so perhaps the relatively flat yield curve is an explanation as to why the financial stocks performed so poorly in March.

Four of the holdings in my Hypothetical Model Portfolio paid dividends in March. As I mentioned in a previous post, the dividends from mutual fund holdings are reinvested, but the dividends from ETFs or a closed end fund (i.e., the Templeton Russia closed-end fund (TRF)) are not reinvested- they will accumulate as "CASH" on the performance table below. The reason I am doing this is because the index mutual funds in this portfolio do not charge a transaction fee for reinvesting dividends. To reinvent dividends for any of the ETFs or TRF, on the other hand, would cause me to incur transaction fees for the trading commissions. Since the dividend on DVY was only $45.43, paying a $5 commission to purchase more shares would not make sense.

The Vanguard S&P 500 index fund (VFINX) paid a dividend of $0.49/share (a total of $93.83) which was reinvested on March 17 to purchase an additional 0.780 shares at a price of $120.35/share. VISVX paid a dividend of $0.009/share (a total of $7.47) which was reinvested on March 17 to purchase an additional 0.467 shares at a price of $15.98/share. NAESX paid a dividend of $0.005/share (a total of $2.12) which was reinvested on March 17 to purchase an additional 0.068 shares at a price of $31.40/share. DVY paid a dividend of $0.56787 on March 20 (a total of $45.43) which was moved to "CASH" on the table shown below.

Sunday, April 02, 2006

The Nasdaq 100 ETF (QQQQ) Is Paying A Quarterly Dividend On April 28, 2006

The Nasdaq 100 ETF (symbol: QQQQ) is paying a dividend of $0.0291 per share on April 28, 2006. This dividend is being paid to shareholders of record as of March 21, 2006.

It took me awhile to find the actual distribution date of this dividend. Yahoo Finance had indicated that the dividend was declared on Marh 17, 2006, but it did not list when the payout date would be. I was finally able to determine the payout date after some searching on google and finding this article.

Thursday, March 30, 2006

Great Article About Dividends At Morningstar.com

Yesterday I was persuing the Yahoo Finance website when I saw a great article about dividends and why they have come back into favor and will become increasingly important in the future.

I highly recommend reading the following article, entitled "Ride the Retiree Wave with Dividends":

It's no secret what's about to crash onto the shores of the American economy. Rather than working for money, the massive baby boom generation expects to have its hard-earned money work for it.

At the same time, another megatrend is rolling through corporate America. Despite all-time record profits, big business isn't investing in new factories, stores, and workers the way it usually does--and the cash is piling up.

If this sounds like a dream scenario for dividend investors, well, it just might be real. We're certainly focusing on these trends in Morningstar DividendInvestor, which I edit. (Click here for more information, including a risk-free trial subscription.) But we can't just buy any dividend-paying stock and expect the newly retired to run it up; a lot of traditional income sectors like real estate investment trusts and utilities are already expensive. If we're going to ride the wave from here, we need an unconventional strategy:

1) Buy dividend potential, not just current yield
2) Look for unconventional sources of income

. . .

Tuesday, March 28, 2006

Investing In Growth Stocks Is Not For The Faint Of Heart

It seems like everyday we are inundated with stories about the next hot growth stocks. For example, people like Jim Cramer have made careers pontificating about the next high-flying stocks and the hottest industries in which to invest. Wall Street loves growth stocks when they are appreciating. For example, the stock market bubble of the late 90s was primarily due to the appreciation of growth stocks. The bubble was highly concentrated among large company growth stocks in general and technology growth stocks in particular.

I don't doubt that there was a lot of money to be made in growth stocks during the late 90s. However, when the actual growth of the underlying companies slows (which it inevitably will), the growth stocks take a beating. Take Cisco (CSCO), the technology bellwether, for example. In the late 90s there were several years when CSCO's PE ratio exceeded 100! After the bubble burst, however, CSCO's earnings took a hit and CSCO's stock price fell from the upper 70s in April 2000 all the way down to about 8 by October 2002. Its stock price has since recovered to about 21 and its forward PE ratio is about 18 right now. However, it stock price experienced an extreme PE compression once the growth ended in the late 90s and its stockholders have taken a bath even though earnings are much higher now than they ever were during the bubble.

This is precisely why investing in high PE growth stocks is so risky - they often continue their upward ascent until the day arrives when an earning target is missed or earnings growth slows. It is not atypical for these stocks to then lose 20+% almost immediately as the market digests the news. The moral is - if you are going to invest in growth stocks be prepared for volatility and be ready to sell if the market really turns on them.

Tuesday, March 21, 2006

Robert Kiyosaki Is A Blowhard

I'm sure that just about everyone has heard of Robert Kiyosaki by now. Kiyosaki is the author of the bestselling "Rich Dad, Poor Dad" series of books. These books all contain a plethora of financial advice and can be quite entertaining. However, Kiyosaki's shtick does become tiresome after awhile. I think that he would be more bearable if I actually believed the stories in his book that he claims to have experienced actually happened.

Through his books, he discusses the contrasting financial advice given to him while he was growing up both by his actual father (his "poor" dad, a well-educated but not financially successful man) and by his next-door playmate's father (his "rich" dad, a high school dropout who was very successful). According to Kiyosaki, he once asked his father how to make money when he was a young boy. His father said he had not made much money and did not know how to make it. He suggested that Robert ask the father of his next-door playmate, who became his "rich dad." Kiyosaki supposedly developed a father-son relationship with the neighbor.

That's a great story. It's too bad none of it is true. Kiyosaki fails to ever mention the name of the alleged "rich dad" in any of his books and newspaper reporters in Hawaii, where Kiyosaki grew up, have been unable to locate the identity of this man. John T. Reed, a real estate guru, has an interesting website that exposed Kiyosaki as a fraud. It would be fine with me if Kiyosaki simply referred to his "rich dad" as a straw man in his books. However, the fact that Kiyosaki insists that this man is real destroys his own credibility.

Kiyosaki also writes a semi-monthly column for Yahoo Finance. In his columns he typically mentions how the U.S. dollar has serious problems going forward and that he bought up lots of oil and gold in the late 90s when everyone else was purchasing technology stocks. I, along with a large portion of Wall Street, happen to agree that the U.S. dollar has some serious problems going forward. However, I don't remember hearing him tell everyone to dump technology stocks, buy commodities, or short the dollar back in the late 90s. If what he says is true, he should provide some documented proof of such. Otherwise, he looks like the type of know-it-all blowhard we've all met who lies about his investment returns to make himself appear smarter than he really is.

Friday, March 17, 2006

Think Twice Before Investing In Companies That Manufacture Memory Devices Or Other Electronic "Commodities"

SanDisk (symbol: SNDK), the market leader in the manufacture of flash memory market, has performed very well over the past year or so. Since July 2005, SNDK has risen from the low 20s to the mid-50s today. One of my friends was recently touting this stock to me and telling me I should pick up some shares. However, I had to caution him. Although I have no doubt that SanDisk is a good company and has been performing well recently, I am of the opinion that an investment in a memory manufacturer must be made only after careful consideration because the stock performance of such companies has been historically extremely volatile.

Another of my college friends invested in Micron Technology (symbol: MU), another big memory manufacturer, back in 1995 after it had fallen from a high of about $90 to a price of about $60 (these prices do not account for the 2:1 split that took place in 2000). My college friend was convinced that this was just a temporary dip that provided a good investing opportunity. My college friend, however, could not have been more wrong. Within months, the bottom fell out for MU as it steadily fell, eventually down past $20. The stock eventually recovered toward the end of 1996 and he sold at about $30, taking a 50% loss on his position.

What neither my current friend nor my college friend fully appreciated is that the business outlook for memory manufacturers can dramatically change in the blink of an eye. There are many different companies that manufacture memory and as far as consumers are concerned, the products of all of these companies are pretty much the same. In other words, there really isn't much brand loyalty (there is, of course, some degree of loyalty, but not much) among consumers when it comes to the purchase of memory products. As such, I consider memory products to be a kind of electronic "commodity." That is, as far as consumers are concerned, there's no major difference between the products manufactured by any of the memory manufactures - consumers primarily will purchase memory products based on price alone.

Therefore, it is extremely difficult and almost impossible to maintain a sustainable competitive advantage over any competitor companies in this field. As a consequence, if one of the memory manufacturers decides to cut prices in order to gain market share, all of the other players are forced to cut their prices as well. These inevitable price wars absolutely kill profit margins.

The point of this post is not to belittle people for investing in memory manufacturers. I have no doubt that there's a lot of money to made in them from time to time - if you look at the historical stock charts for SNDK and MU, you'll see some terrific periods of time where these stocks went up hundreds of percentage points during a short time span. However, there are also some horrible stretches where the bottom fell out of the stock prices. I don't claim to be an expert investor - I've certainly made my own mistakes as well. Although I've never directly invested in a memory manufacturer, I have invested in stocks in the disk drive sector, which experiences analogous problems. I owned shares of Applied Magnetics, a disk drive component manufacturer, back in the late 1990s and lost my complete position when it went bankrupt.

So the moral is that you should perform extra diligence before investing in any memory manufacturer (or any company that produces an electronic commodity).

Thursday, March 16, 2006

The Nasdaq 100 ETF Can Now Be Purchased Without Paying A Commission

Nasdaq Global Funds has instituted an investment program entited "QQQDirect" which allows individual investors to directly purchase shares of the Nasdaq 100 index tracking ETF, QQQQ. To sign up for this program, go to this website: http://qqqdirect.com/. According to the Nasdaq Global Funds, participants will be able to purchase shares of QQQQ once a month without having to pay any commissions. The minimum monthly investment is $10, and additional purchases will be either $3.99 or less if the participant signs up for a pre-selected investment program. The great thing about this is that there are no account setup, minimum balance, or inactivity fees. The main applicable fee is a $12.99 commission to be paid when the participant sells shares through the plan.

I think this is a great program for small investors who want to invest in QQQQ via dollar-cost averaging. Hopefully the S&P 500 (symbol: SPY) or S&P Midcap (symbol: MDY) ETFs will follow suit with similar plans.

Friday, March 10, 2006

The 6-Year Anniversary of the Nasdaq Composite's All-Time High Close

On March 10, 2000, the Nasdaq composite index closed at an all-time high of 5048.62. Shortly thereafter, the stock market bubble burst, dropping the Nasdaq composite down to an intra-day low of 1108.49 on October 10, 2002, a drop of about 78% in just over two years. In the subsequent rally through today's close of 2262.04, the Nasdaq composite index has risen about 104% from its 2002 low. However, it still remains about 55% below its all-time high closing value.

CNN.com has a nice article about the 6-year anniversary of the Nasdaq composite's all-time high close.

Wednesday, March 08, 2006

The Templeton Russia & East European Fund Closed-End Fund Has Been Dropping Like A Rock

As I have previously mentioned, Russia is projected to be one of the fastest growing economies over the next several decades. According to a 2003 Goldman Sachs report, Russia's economy is projected to grow much faster than the U.S.'s from now until 2050, and its currency exchange rate is projected to strengthen by 200+%. Russia therefore presents an exciting investing opportunity and assuming Russia maintains a stable political system, should be an excellent market in which to invest over the next several decades. However, the Russian stock market is not for the faint of heart. The Templeton Russia & East European Fund Closed-End Fund (TRF), one of the best-performing funds investing solely in Russia, has dropped from $79.12 at Monday's market close down to $69.99 as of today's market close, a drop of 11.5% in just two days! However, the fund is still up 28.1% so far in 2006. Despite its overall impressive returns, the volatility can be somewhat unsettling.

Monday, March 06, 2006

About Me

For those of you who are interested, I work in the legal profession and have been following and investing in the stock market for over 10 years. I invest almost half of my after-tax income in the stock market every month. I do have some money in individual stocks, but am currently concentrating on building up my long-term portfolio. FYI, my long-term portfolio is the same as the hypothetical portfolio I have been tracking this year. However, unlike the hypothetical portfolio, I do not yet currently own shares of each of the 10 holdings of the long-term portfolio. Instead, to keep my trading commissions at a minimum, I have been purchasing shares of one additional holding in my long-term portfolio each month in an effort to match the percentage holdings my model portfolio dictates.

The reason why I invest this way is because I used to invest primarily in the S&P 500 when I had the deluded belief that I was "buying the market" and that this was the safest way to invest. Accordingly, my portfolio is substantially overweighted with shares of the S&P 500 index. (I also started purchasing shares of Vanguard's Midcap fund several years ago and am also overweighted in that fund. However, that's not such a bad thing, as the Midcap index has performed very well since 2003.)

Given the passage of time since the bubble burst in 2000, I have definitely learned some powerful lessons about the markets. I now appreciate how cyclical different styles of stocks can be, regardless of the underlying fundamentals of the representative companies. For example, the S&P 500 index is primarily a large cap index and has been pretty much flat for the past 5 years even though the earnings of the S&P 500 constituent companies have increased by somewhere around 60+%.

It seems to me that any reasonable portfolio should include midcap and small cap (especially small cap value) index funds, as they outperform their larger peers over time. Also, I now realize that given the massive U.S. trade deficit, it is a good idea to own foreign stocks, because they should outperform when the U.S. dollar inevitably weakens against foreign currencies.

I also have some additional money that I occasionally invest in individual stocks. When investing in individual stocks, I am very selective and will invest in only one or two (or maybe three) stocks at a time, but I like to make big bets. I get my ideas from the Value Line, an invaluable resource. I tend to invest in retailers and semiconductors when I do invest in individual stocks. Instead of trying to invest in the next "hot" sector, I tend to follow these same sectors (i.e., retailing and semiconductors) and buy when good stocks in those industries are being dumped. I realize that other people can do very well by investing in hot industries, but I think I personally perform my best by concentrating my bets of just a couple industries while following those industries closely, learning all that I can.

Tuesday, February 28, 2006

February Returns For My Model Long-Term Portfolio

February was a somewhat volatile month for my hypothetical model long-term portfolio. The portfolio was in the red for most of the month, pushing into postive territory during the last full week of February, and then dipped back down on the last day of the month, the 28th, closing down $51.20 for February. However, after the impressive January returns, the portfolio is still up $6212 for 2006, a gain of 6.21%.

The returns are shown in the chart below (click for a bigger image). As shown, the TRF (the Templeton Russia closed-end fund) was my top performer, followed by DVY (the dividend ETF), XLF (the S&P 500 Financials ETF), and VFINX (the Vanguard S&P 500 fund). The worst performers, on the other hand, were EEM (the iShares Emerging Markets ETF), VIMSX (the Vanguard mid-cap index fund), and QQQQ (the Nasdaq 100 ETF). My portfolio did ok because of the strength of the Russia stock market and of the large-cap stocks that dominate DVY, XLF, and VFINX. Perhaps we are finally witnessing the start of the long-awaited outperformance of large-cap relative to small-cap stocks. I guess we'll have to wait and see what happens in March...

Wednesday, February 22, 2006

S&P 500 Dividends

I was looking at the Standard & Poor's website today when I discovered a file posted there containing historical dividend information for the S&P 500 dating back to 1988. I have entered this historical dividend information into the chart below. As shown, the dividends paid by the S&P 500 component companies increased from $9.73 in 1988 to $22.22 in 2005. That works out to an average annual increase of 4.978% in the dividend yield. That's impressive, especially considering that this time period includes the horrible bear market from 2000 to 2002 when the S&P 500 lost around 50% of its value.

As shown below, the annual % increase of dividends has been increasing very rapidly since 2002. That is undoubtedly due to the strong corporate profits and the dividend tax decrease that Congress passed in 2003. According to Standard & Poor's, the dividends are projected to increase to $24.50 for 2006, a 10.26% increase over 2005.

I anticipate large % increases in the dividend rate in the coming years. With the favorable tax treatment and Baby Boomers nearing retirement age, the Boomers are going to want extra dividend income and will pressure companies to keep raising dividends. This is definitely a plus for investors. The great thing about dividends is that they provide investors with a return without forcing the investors to sell at inopportune moments to realize these returns.


***An updated version of this chart containing data from 1977-2014 may be found in this post.

Tuesday, February 21, 2006

February 2006 Update - The S&P 500 Index Is Still Undervalued

I wrote a post last November in which I argued that the S&P 500 was undervalued. Since then, the S&P 500 has risen 5.16%, from about 1220 to 1283. This is a pretty good gain, but I think that the S&P 500 has further to go. Relative to bonds, the S&P 500 is still undervalued and due for more gains.

According to Standard & Poor's, the projected reported earnings through 12/31/06 for the sum of the components of the S&P 500 is about $79.30/share. As discussed above, the S&P 500 index currently trades at about 1283. Accordingly, the forward P/E ratio of the S&P 500 index is about 16.18 (1283/$79.30). This is slightly higher than the historical P/E ratio of around 14-15. However, bonds are much more richly valued than their historical averages. Moreover, other asset classes such as real estate and commodities are also richly valued right now. It therefore seems inevitable that stocks will eventually catch up to the performance of these other asset classes.

Stocks have been weighed down over the past year in large part due to high energy prices and a FED that has been steadily raising short-term interest rates. However, consumer price inflation is still relatively low and bonds are expensive. The yield on the 10-yr US bond is currently about 4.56%. The earnings yield on the S&P 500 based on estimated 2006 earnings is about 6.18% (i.e., the inverse of the 16.18 P/E ratio). Therefore the earnings yield on the S&P 500 is about 1.62% higher than the 10-yr bond yield. This is large disparity and is certain to shrink over the next few years as the S&P 500 outperforms the 10-yr bond.

I believe that 2006 will continue to be a good year for the S&P 500. The S&P 500 probably won't increase in value every month, but even after accounting for a pullback or two this should be a good year nevertheless.

Great new real estate website

Many of the people out there who have substantial or rapidly growing stock portfolios probably also own real estate. I personally bought my first property last year. In my opinion, one of the important things to do before making a bid on a home is to do a little research on the prices for which comparable homes have been selling.

As luck would have it, a fantistic new real estate website was released recently. I found out about it a week ago and have used it several times. The name of the website is Zillow.com, and it provides estimates of a home's value as well as esitmates of nearby comparable homes. It also lists the square footage of homes, the most recent property tax bills, and the date and amount of the most recent sale (if within the past 5 or 10 years). There are also maps and charts of the average value of the home over the previous 5-10 years and the average value of all homes in the same zip code over the same time period.

I highly recommend Zillow.com to anyone looking to purchase a home anytime soon.