Showing posts with label Model portfolio. Show all posts

Saturday, December 01, 2007

November 2007 Returns For My Model Long-Term Portfolio

The October 2007 results for my Hypothetical Model Portfolio were the worst performance (on a % basis) since I created the portfolio back in 2006. The returns were very volatile throughout the month, as recession fears permeated through the market.

As of the market close on November 30, 2007, the Hypothetical Model Portfolio was down $9045, or about 5.51% during November. However, the Hypothetical Model Portfolio is still up about $9522 in 2007, a gain of 6.556%, as shown on the table below (click for a larger image of the table). The 2007 returns for the Hypothetical Model Portfolio are currently slightly ahead of the 6.15% return of the Vanguard S&P 500 Index fund (VFINX), my benchmark proxy for the S&P 500 index.

All of the holdings were down in November, with financials and emerging markets leading the charge downward. The SPDR Financial components ETF (XLF) dropped 8.09%, likely due to that large position it holding in Citigroup, a company that performed very poorly during the month as it announced huge losses and the exit of its chairman and CEO. Emerging markets dropped due the overall stock market turbulence, as the riskiest equities tend to plummet the most during times of uncertainty. The Templeton Russia closed-end fund (TRF) dropped 8.0% and the iShares Emerging Markets ETF (EEM) dropped 7.65%. Tech stocks also struggled, with the Nasdaq 100 ETF (QQQQ) dropping 6.76%.

Small caps and midcaps struggled during the month. The Vanguard Small Cap Index mutual fund (NAESX) dropped 6.79% and the Vanguard Small Cap Value Index fund (VISVX) fell 6.74%. The Vanguard Midcap Index mutual fund (VIMSX) was the only other holding to fall more than 5% during the month.

The results of the portfolio holdings for the first 11 months of 2007 have varied substantially, with six holdings showing gains and four showing losses. The biggest gainer so far is EEM, which is up about 35.24% for the year. The biggest loser is TRF, which has fallen about 16.58%, primarily due to premium compression, as I have previously discussed.

I anticipate that the portfolio returns will continue to be volatile in December and expect the portfolio to close out 2007 with a small gain of 5-10% for the year. It would not surprise me if the U.S. economy slips into recession in early 2008. If a recession does occur, I expect it to be a very mild recession. Global growth is strong and should help support the U.S. economy even in the face of recessionary winds.

*The Hypothetical Model Portfolio was created with an investment of $100,000 in securities as of the closing values on December 30, 2005 and an additional $25,000 was invested n securities as of the closing values on December 29, 2006. The reason why the total cost in the chart is greater than $125,000 is because the total cost accounts for the value of distributions reinvested into the mutual funds in the portfolio.

October 2007 Returns
Saturday, November 03, 2007

October 2007 Returns For My Model Long-Term Portfolio
My Hypothetical Model Portfolio had its second strongest performance (on a % basis) of 2007 during October. Although the month was volatile, the Portfolio rallied on October 31st when the Federal Reserve cut its benchmark overnight interest rate by 25 basis points to 4.50%. The FED released a statement indicating that it now thinks the risks of recession and higher inflation are in "balance," a signal that the FED is less likely to make another cut down the road.

As of the market close on October 31, 2007, the Hypothetical Model Portfolio was up $5637, or about 3.56% during October. The Hypothetical Model Portfolio is now up about $18567 in 2007, a gain of 12.76%, as shown on the table below (click for a larger image of the table). Based on the strong October returns, the 2007 returns for the Hypothetical Model Portfolio are now ahead of the 10.83% return of the Vanguard S&P 500 Index fund (VFINX), my benchmark proxy for the S&P 500 index.

International stocks generally led the way again in October, most likely due to the FED's interest rate cut, which devalues the U.S. Dollar, and consequently increases the value of foreign-denominated assets such as international equities. The iShares Emerging Markets ETF (EEM) was my best performing holding, rising about 11.87%. The Templeton Russia closed-end fund (TRF) rose about 8.74%, and the Vanguard Developed Markets Index mutual fund (VDMIX) rose about 4.41%.

Tech stocks were also strong performers during October - the Nasdaq 100 ETF (QQQQ) rose an impressive 7.09%. Small caps also performed well, with the Vanguard Small Cap Index mutual fund (NAESX) rising 2.62% and Vanguard Small Cap Value Index (VISVX) returning about 1.34%.

Financials were laggards again - the SPDR Financial components ETF (XLF) dropped 0.97%, whereas the iShares Dow Jones U.S. Select Dividend Index Fund (DVY) rose a scant 0.93%.

The results of the holdings in the Hypothetical Model Portfolio have been very disparate through the first 10 months of 2007. EEM, QQQQ, and VDMIX are leading the way with phenomenal returns of 46.44%, 27.71%, and 18.62%. Four of the holdings, on the other hand, have had abysmal returns - TRF, XLF, DVY, and VISVX have returns -9.92%, -6.54%, 0.49%, and 1.03% respectively for the year. The winners have more than made up for the weak performance for the poor performers, and the portfolio is currently nearly a full two percentage points ahead of the 10.83% return of the Vanguard S&P 500 Index fund (VFINX), my benchmark proxy for the S&P 500 index, as discussed above.

Three of the holdings in my Hypothetical Model Portfolio paid dividends during October. As I mentioned in a previous post, I reinvest the dividends from mutual fund holdings when distributed. I allow dividends from closed end funds or the ETFs to accumulate in the "CASH" column until it reaches at least $100, at which point I invest the CASH in the mutual funds lagging my benchmark asset allocation by the largest amount at the time. The reason why I wait until $100 is accumulated is because that is the minimum amount required to invest in a Vanguard mutual fund at a time.

At the end of September, the CASH column totaled $66.05. On October 1st, DVY paid a dividend of $0.59722/share (a total of $59.72). This dividend payment was immediately moved into CASH, and the CASH column accumulated a total of $125.77 as of October 1, 2007. As of that date, the most underperforming mutual fund holding was VISVX. Accordingly, on the following date, October 2, 2007, $125.77 was invested in VISVX to purchase an additional 7.207 shares at $17.45/share.

Two other holdings paid dividends in October. On October 3, 2007, XLF paid a dividend of $0.2554/share (a total of $25.03), which was moved to "CASH" on the table shown below. QQQQ paid a dividend of $0.026/share (a total of $5.46) on October 31st, which was also moved to "CASH" on the table shown below.

I anticipate that the portfolio returns will continue to be volatile for the rest of 2007 and will probably be slightly higher by the end of December, 2007.

*The Hypothetical Model Portfolio was created with an investment of $100,000 in securities as of the closing values on December 30, 2005 and an additional $25,000 was invested n securities as of the closing values on December 29, 2006. The reason why the total cost in the chart is greater than $125,000 is because the total cost accounts for the value of distributions reinvested into the mutual funds in the portfolio.

September 2007 Returns

Sunday, October 14, 2007

September 2007 Returns For My Model Long-Term Portfolio

My Hypothetical Model Portfolio registered its strongest performance (on a % basis) in nearly a year during September. The Portfolio was down for the month until the Federal Reserve unexpectedly cut interest rates by 50 basis points on September 18th, sparking a strong stock market rally. The FED said the rate cut was intended to "help forestall some of the adverse effects on the broader economy that might otherwise arise from the disruptions in financial markets."

As of the market close on September 28, 2007, the Hypothetical Model Portfolio was up $6173, or about 4.06% during September. The Hypothetical Model Portfolio is now up about $12929 in 2007, a gain of 8.89%, as shown on the table below (click for a larger image of the table). The 2007 returns for the Hypothetical Model Portfolio still slightly trail the 9.10% return of the benchmark Vanguard S&P 500 Index fund (VFINX), my benchmark proxy for the S&P 500 index.

International stocks led the way in September, with the iShares Emerging Markets ETF (EEM) rising about 11.57%, the Templeton Russia closed-end fund (TRF) rising sbout 9.61%, and the Vanguard Developed Markets Index mutual fund (VDMIX) rising about 5.39%. The FED's rate cut weakens the U.S. currency relative to foreign currencies and was a major cause of the strong returns for foreign stocks during September.

Tech stocks were also strong performers during September - the Nasdaq 100 ETF (QQQQ) rose a strong 5.20%. Large caps also performed well, with VFINX rising 3.72%.

Financials were laggards - the iShares Dow Jones U.S. Select Dividend Index Fund (DVY) rose a scant 0.30% and the Vanguard Small Cap Value Index (VISVX), a fund holding many financial stocks, rising just 1.69%.

Through the first 9 months of 2007, foreign and tech stocks have been carrying the Hypothetical Model Portfolio. EEM has led the way, with a return of about 30.9%, QQQQ has returned about 19.26%, and VDMIX has appreciated about 13.58%.

One of the holdings in my Hypothetical Model Portfolio, VFINX, paid dividends during September. As I mentioned in a previous post, the dividends from mutual fund holdings are reinvested. VFINX paid a dividend of $0.62/share (a total of $153.38) which was reinvested on September 21 to purchase an additional 1.091 shares at a price of $140.49/share.

I was glad to see decent returns during September. I anticipate that the portfolio will rise a few more percentage points over the last three months of the year and will close out 2007 up 10-15% for the year.

*The Hypothetical Model Portfolio was created with an investment of $100,000 in securities as of the closing values on December 30, 2005 and an additional $25,000 was invested n securities as of the closing values on December 29, 2006. The reason why the total cost in the chart is greater than $125,000 is because the total cost accounts for the value of distributions reinvested into the mutual funds in the portfolio.

August 2007 Returns

Saturday, September 22, 2007

August 2007 Returns For My Model Long-Term Portfolio

My Hypothetical Model Portfolio rebounded in August after registering negative returns in June and July. As of the market close on August 31, 2007, the Hypothetical Model Portfolio was up $1324, or about 0.88% during August. The Hypothetical Model Portfolio is now up about $6756 in 2007, a gain of 4.64%, as shown on the table below (click for a larger image of the table). The 2007 returns for the Hypothetical Model Portfolio now slightly trail the 5.14% return of the benchmark Vanguard S&P 500 Index fund (VFINX).

Tech stocks led the way in August, with the Nasdaq 100 ETF (QQQQ) rising 2.82%. QQQQ is now up an impressive 13.38% this year. I certainly never would have predicted at the beginning of the year that QQQQ would be one of the top performing U.S. stock market indices for the year.

Financials also performed very well in August, gaining back some of the ground they lost in June and July. The SPDR Financial components ETF (XLF) rose about 2.58% and the iShares Dow Jones U.S. Select Dividend Index Fund (DVY) rose about 2.05%.

Other broad U.S. stock market indices also registered decent returns. The Vanguard S&P 500 Index fund (VFINX) returned about 1.50%, the Vanguard Small Cap Value Index (VISVX) returned about 1.45%, and the Vanguard Small Cap Index mutual fund (NAESX) returned around 1.34%.

International stocks struggled during the month, with the Templeton Russia closed-end fund (TRF) dropping about 6.46% and the Vanguard Developed Markets Index mutual fund (VDMIX) dropping around 0.66%. TRF's return this year has been awful. As I have previously discussed, the primary reason for TRF's subpar returns has been due to premium compression of its closed-end shares due to the introduction of the first Russian stock market ETF. The Net Asset Value ("NAV") for TRF was actually up around 4% as of the end of August, but the shares were down more than 20% because the NAV premium fell from around 38% at the beginning of January 2007 down to about 0.67% as of the end of August.

The Model Portfolio's returns have been very volatile so far this year. Many pundits apparently think that the country is headed for recession. The FED will do everything in its power to prevent the U.S. economy from contracting and if the FED is successful, I expect the markets to soar much higher. On the other hand, if the FED is not successful, we will probably experience the first bear market since the awful contraction between 2000 and 2002.

*The Hypothetical Model Portfolio was created with an investment of $100,000 in securities as of the closing values on December 30, 2005 and an additional $25,000 was invested n securities as of the closing values on December 29, 2006. The reason why the total cost in the chart is greater than $125,000 is because the total cost accounts for the value of distributions reinvested into the mutual funds in the portfolio.

July 2007 Returns

Saturday, August 04, 2007

July 2007 Returns For My Model Long-Term Portfolio

My Hypothetical Model Portfolio performed very poorly during July as the overall market swooned. As of the market close on July 31, 2007, the Hypothetical Model Portfolio was down $5,560.57, or about 3.55% during July. July 2007 was the worst month for the Hypothetical Model Portfolio since last May, 2006 when the Hypothetical Model Portfolio dropped 4.92%. Despite the awful July results, the Hypothetical Model Portfolio is still up about $5432 in 2007, a gain of 3.73%, as shown on the table below (click for a larger image of the table). Morever, the Hypothetical Model Portfolio is still outperforming the 3.58% return of the benchmark Vanguard S&P 500 Index fund (VFINX).

Financials experienced their second consecutive awful month, with the SPDR Financial components ETF (XLF) plummeting 9.07% and the iShares Dow Jones U.S. Select Dividend Index Fund (DVY) dropping 5.02%. Financials are still performing poorly due to the overhang from problems in the subprime lending market. Another poor performer with a large amount of financial exposure was the Vanguard Small Cap Value Index (VISVX), which dropped 7.21%. Other small cap issues also underperformed, resulting in the Vanguard Small Cap Index mutual fund (NAESX) dropping 5.76% during the month.

The only moderately impressive returns were registered by the iShares Emerging Markets ETF (EEM), which rose 0.70%, the Templeton Russia closed-end fund (TRF), which rose 0.46%, and the Nasdaq 100 ETF (QQQQ), which only fell by 0.07% in a weak market. This marks the second consective month during which TRF has registered a gain, following five months of declines from January - May 2007.

As of the end of July, two of the portfolio holdings are up in double digits so far in 2007 - EEM, which is up just over 16%, and QQQQ, which is up just over 10%. The performance of QQQQ has really surprised me, as I had not anticipated tech stocks to outperform this year.

Two of the holdings in my Hypothetical Model Portfolio paid dividends in July. As I mentioned in a previous post, the dividends from mutual fund holdings are reinvested, but the dividends from ETFs or a closed end fund (i.e., the Templeton Russia closed-end fund (TRF)) are not reinvested - instead, they will accumulate as "CASH" on the performance table below until at least $100 has accrued, at which point that money will be reinvested in one of the mutual fund holdings. The reason I am doing this is because the index mutual funds in this portfolio do not charge a transaction fee for reinvesting dividends. To reinvent dividends for any of the ETFs or TRF, on the other hand, would cause me to incur transaction fees for the trading commissions.

QQQQ paid a dividend of $0.037/share (a total of $7.76) on July 31st, which was moved to "CASH" on the table shown below. DVY paid a dividend of $0.58298 on July 5th (a total of $58.29), which was also moved to "CASH" on the table shown below.

The stock market's performance recently is somewhat disconcerting. However, I do not see any cause for alarm. The pullback during May and June 2006 was far worse than this one, and everything turned out well by the end of 2006. I think we are merely experiencing a correction right now. Corrections are absolutely necessary to maintain an orderly market with manageable levels of risk.

*The Hypothetical Model Portfolio was created with an investment of $100,000 in securities as of the closing values on December 30, 2005 and an additional $25,000 was invested n securities as of the closing values on December 29, 2006. The reason why the total cost in the chart is greater than $125,000 is because the total cost accounts for the value of distributions reinvested into the mutual funds in the portfolio.

June 2007 Returns

June 2007 Returns For My Model Long-Term Portfolio

My Hypothetical Model Portfolio registered a negative return during June 2007. As of the market close on June 29, 2006, the Hypothetical Model Portfolio was down $1682.12, or about 1.06% during June. However, due to strong results earlier in the year, the Hypothetical Model Portfolio is still up about $10,992 in 2007, a gain of 7.56%, as shown on the table below (click for a larger image of the table). The Model Portfolio is still outperforming the 6.91% return of the benchmark Vanguard S&P 500 Index fund (VFINX).

Foreign holdings were the best performers, led by the 3.82% increase in the iShares Emerging Markets ETF (EEM) and the 2.96% gain in the Templeton Russia closed-end fund (TRF). June was the first month since December 2006 during which TRF has posted a gain. Perhaps the premium compression of TRF is finally over.

Financials were the worst portfolio performers during June, with the SPDR Financial components ETF (XLF) dropping 4.00% and the iShares Dow Jones U.S. Select Dividend Index Fund (DVY) dropping 3.99%. Financials performed poorly due to the overhang from problems in the subprime lending market. Another poor performer during June was the Vanguard Small Cap Value Index (VISVX), which dropped 2.51%. VISVX has a fairly large exposure to financial stocks and is now paying the price for it.

Three of the holdings in my Hypothetical Model Portfolio paid dividends in June. As I mentioned in a previous post, the dividends from mutual fund holdings are reinvested, but the dividends from ETFs or a closed end fund (i.e., the Templeton Russia closed-end fund (TRF)) are not reinvested- they will accumulate as "CASH" on the performance table below until at least $100 has accrued, at which point that money will be reinvested in one of the mutual fund holdings. The reason I am doing this is because the index mutual funds in this portfolio do not charge a transaction fee for reinvesting dividends. To reinvent dividends for any of the ETFs or TRF, on the other hand, would cause me to incur transaction fees for the trading commissions.

The Vanguard Index 500 mutual fund (VFINX) paid a dividend of $0.57/share (a total of $139.82), which was reinvested on June 22nd to purchase an additional 1.011 shares at a price of $138.82/share. TRF paid a long-term capital gain of $3.9272 on June 19th (a total of $251.34), which was moved to "CASH" on the table shown below. Finally, the S&P 500 Financial components ETF (XLF) paid a dividend of $0.204 on June 27th (a total of $19.98), which was moved to CASH.

As of June 29, 2007, there was a total of $347.45 in CASH. Because this amount was greater than $100, I reinvested this money in the Vanguard mutual fund holdings that lagged my target allocation by the largest amount. In this case, VISVX and VFINX were the only two Vanguard mutual fund holdings of which less than the target allocation amounts were held as of June 29th. Accordingly, on the 29th, $200 from CASH was re-invested in VISVX to purcash 11.179 shares at $17.89/share, and $147.45 was re-invested in VFINX to purchase 1.065 shares at $138.43/share. I put more into VISVX than into VFINX because VISVX trailed its target allocation by a larger amount than VFINX. These re-investments are indicated on the June chart below.

*The Hypothetical Model Portfolio was created with an investment of $100,000 in securities as of the closing values on December 30, 2005 and an additional $25,000 was invested n securities as of the closing values on December 29, 2006. The reason why the total cost in the chart is greater than $125,000 is because the total cost accounts for the value of distributions reinvested into the mutual funds in the portfolio.

May 2007 Returns

Friday, August 03, 2007

May 2007 Returns For My Model Long-Term Portfolio

My Hypothetical Model Portfolio performed very well during May, generating its largest dollar increase since January 2006 and the largest return, on a percentage basis, since October 2006, matching the 3.47% return achieved during April 2007. As of the market close on May 31, 2007, the Hypothetical Model Portfolio* closed up by $5,299.73 during May. The Hypothetical Model Portfolio is now up $12,674 in 2007, a gain of 8.71%, as shown on the table below (click for a larger image of the table).

All of my holdings were up except for the Templeton Russia closed-end fund (TRF), which had its fifth consecutive monthly drop in value due primarily to its ongoing premium compression, as I have discussed previously. The other nine holdings in the Model Portfolio all rose, led by the 4.93% return of the iShares Emerging Markets ETF (EEM) , the 4.41% return of the Vanguard Small Cap Index mutual fund (NAESX), and the 4.34% return of the Vanguard Midcap Index mutual fund (VIMSX). Financials lagged slightly during May, with iShares Dow Jones U.S. Select Dividend Index Fund (DVY) rising only 1.97% and the SPDR Financial components ETF (XLF) rising 2.40%.

Through the end of May, the Model Portfolio is up 8.71%, slightly trailing the 8.74% return of the Vanguard Index 500 mutual fund (VFINX). Four of the holdings are up over 11% so far this year. VIMSX is the biggest winner so far, having risen 13.12% in 2007, EEM has risen 11.06%, the Vanguard Developed Markets Index mutual fund (VDMIX) has risen 11.03%, and NAESX has risen 11.02%. The only negative performer so far has been the 2006 portfolio leader, TRF, which is now down a huge 21.25% in 2007.

None of the holdings paid dividends during May. However, QQQQ paid a dividend during April (on April 30, 2007) that I inadvertantly neglected to mention during my summary of the April results. The QQQQ dividend was $0.027/share, a total of $5.67. This dividend is listed in the chart below and was added to the CASH position. As I mentioned in a previous post, the dividends from mutual fund holdings are reinvested, but the dividends from ETFs or TRF are not reinvested- they will accumulate as "CASH" on the performance table below until at least $100 has accrued, at which point that money will be reinvested in one of the mutual fund holdings. The reason I am doing this is because the index mutual funds in this portfolio do not charge a transaction fee for reinvesting dividends. To reinvent dividends for any of the ETFs or TRF, on the other hand, would cause me to incur transaction fees for the trading commissions.

As of May 31, 2007, the premium on TRF is still a relatively low 6.18%, down from the typical double digit premium of the past few years. I still suspect that TRF's premium compression is pretty much over and expect TRF to start outperforming other holdings in the Hypothetical Model Portfolio just like it did during the last few months of 2006.


*The Hypothetical Model Portfolio was created with an investment of $100,000 in securities as of the closing values on December 30, 2005 and an additional $25,000 was invested n securities as of the closing values on December 29, 2006. The reason why the total cost in the chart is greater than $125,000 is because the total cost accounts for the value of distributions reinvested into the mutual funds in the portfolio.

April 2007 Returns

Saturday, May 05, 2007

April 2007 Returns For My Model Long-Term Portfolio

My Hypothetical Model Portfolio performed very well during April, generating its largest returns since October 2006. As of the market close on April 30, 2007, the Hypothetical Model Portfolio* was up $5,131.37, or 3.47% during April. The Hypothetical Model Portfolio is now up $7375 in 2007, a gain of 5.07%, as shown on the table below (click for a larger image of the table).

All of my holdings were up except for the Templeton Russia closed-end fund (TRF), which had fourth consecutive monthly drop in value due primarily to its ongoing premium compression, as I have discussed previously. Tech stocks, large caps, and financials led the way, with the Nasdaq 100 ETF (QQQQ) rising about 5.58%, the Vanguard Index 500 mutual fund (VFINX) rising about 4.42%, and the SPDR Financial components (XLF) rising about 3.87%. International equities were also strong, with the Vanguard Developed Markets index fund (VDMIX) rising about 3.81% and the Emerging Markets ETF (EEM) rising about 3.73%. Small caps lagged during April - the Vanguard Small Cap Index mutual fund (NAESX) rose about 2.67% and the Vanguard Small Cap Value Index (VISVX) rose a paltry 1.84%.

The Hypothetical Model Portfolio has risen the same amount as the S&P 500 (with dividends reinvested) - 5.07% so far during 2007. Considering that TRF is down over 19% so far this year, I'm pleased that the Hypothetical Model Portfolio has risen the same amount as the S&P 500. As of April 30, 2007, the premium on TRF is down to 2.91%. I suspect that TRF's premium compression is pretty much over and expect TRF to start outperforming other holdings in the Hypothetical Model Portfolio just like it did during the last few months of 2006.


*The Hypothetical Model Portfolio was created with an investment of $100,000 in securities as of the closing values on December 30, 2005 and an additional $25,000 was invested n securities as of the closing values on December 29, 2006. The reason why the total cost in the chart is greater than $125,000 is because the total cost accounts for the value of distributions reinvested into the mutual funds in the portfolio.

Sunday, April 08, 2007

March 2007 Returns For My Model Long-Term Portfolio

My Hypothetical Model Portfolio performed fairly well during March. As of the market close on March 30, 2006, the Hypothetical Model Portfolio was up $2159.30, or about 1.48% during March. The Hypothetical Model Portfolio is now up about $2243 in 2007, a gain of 1.54%, as shown on the table below (click for a larger image of the table).

Foreign holdings were the best performers, with the iShares Emerging Markets ETF (EEM) rising an impressive 6.15% and the Vanguard Developed Markets Index mutual fund (VDMIX) rising 2.58%. Several other holding rose more than 1% in March, including (a) iShares Dow Jones U.S. Select Dividend Index Fund (DVY), which rose 1.44%; (b) Vanguard Small Cap Index (NAESX), which rose 1.22%; and (c) Vanguard Index 500 mutual fund (VFINX), which rose 1.11%.

Unfortunately, however, negative performances were turned in by two holdings. The Templeton Russia closed-end fund (TRF) fell about 0.61% and the S&P 500 Financial components ETF (XLF) fell about 0.48%. TRF finished March down 19.35% so far during 2007. As I have previously discussed, TRF's performance is odd because its underlying net asset value ("NAV") has actually risen about 6.7% (from $63.23 to $67.48), but it share price has fallen because its premium has plummeted from 38.07% at the end of December 2006 to 4.34% at the end of March 2007.

Six of the holdings in my Hypothetical Model Portfolio paid dividends in March. As I mentioned in a previous post, the dividends from mutual fund holdings are reinvested, but the dividends from ETFs or a closed end fund (i.e., the Templeton Russia closed-end fund (TRF)) are not reinvested- they will accumulate as "CASH" on the performance table below until at least $100 has accrued, at which point that money will be reinvested in one of the mutual fund holdings. The reason I am doing this is because the index mutual funds in this portfolio do not charge a transaction fee for reinvesting dividends. To reinvent dividends for any of the ETFs or TRF, on the other hand, would cause me to incur transaction fees for the trading commissions.

VFINX paid a dividend of $0.55/share (a total of $134.36), which was reinvested on March 23rd to purchase an additional 1.016 shares at a price of $132.20/share. The Vanguard Mid Cap Index (VIMSX) paid a dividend of $0.005/share (a total of $5.75), which was reinvested on March 21st to purchase an additional 0.276 shares at a price of $20.86/share. The Vanguard Small Cap Value Index (VISVX) paid a dividend of $0.013/share (a total of $13.37), which was reinvested on March 21st to purchase an additional 0.762 shares at a price of $17.54/share. NAESX paid a dividend of $0.006/share (a total of $3.22), which was reinvested on March 21st to purchase an additional 0.095 shares at a price of $33.95/share. The iShares Dow Jones U.S. Select Dividend Index Fund (DVY) paid a dividend of $0.55956 on March 29th (a total of $55.96), which was moved to "CASH" on the table shown below. Finally, the S&P 500 Financial components ETF (XLF) paid a dividend of $0.148 on March 28th (a total of $14.50), which was moved to CASH.

*The Hypothetical Model Portfolio was created with an investment of $100,000 in securities as of the closing values on December 30, 2005 and an additional $25,000 was invested n securities as of the closing values on December 29, 2006. The reason why the total cost in the chart is greater than $125,000 is because the total cost accounts for the value of distributions reinvested into the mutual funds in the portfolio.

February 2007 Returns

Sunday, March 11, 2007

February 2007 Returns For My Model Long-Term Portfolio

February was a very volatile month for my Hypothetical Model Portfolio. The portfolio was performing very well until February 27th when the market corrected with the Dow dropping about 3.3% (416 points), the S&P 500 index dropping about 3.5%, and the NASDAQ composite dropping about 3.9%.

As of the market close on February 28, 2007, the Hypothetical Model Portfolio* decreased in value by $1684.95, or about 1.14% during the month of February. However, despite February's lousy returns, the Hypothetical Model Portfolio is still up about $84.57 in 2007, a gain of 0.06%, as shown on the table below (click for a larger image of the table).

Only two of the holdings failed to decrease in value - the Vanguard Developed Markets Index mutual fund (VDMIX) and the Vanguard Mid Cap Index (VIMSX). VDMIX rose about 0.31% and VIMSX closed the month at the same price at which it ended in January. VIMSX has performed surprisingly well so far this year and is up about 3.65% through the end of February.

Emerging markets were the worst performers, with the Templeton Russia closed-end fund (TRF) decreasing by about 4.40% and the iShares Emerging Markets ETF (EEM) dropping about 3.98%. The only other holding to drop more than 3% was S&P 500 Financial components ETF (XLF), which fell about 3.05%. TRF has now dropped about 18.85% during the first two months of 2007. The primary reason for TRF's poor performance is compression of its closed-end Net Asset Value premium, as I have previously discussed.

It seems as though 2007 is going to be a volatile year. However, stock market valuations, especially those of U.S. markets, are still right around historical averages. Consequently, I don't see a huge sustained market drop happening anytime soon. I still anticipate my Hypothetical Model Portfolio performing well in 2007 and note that despite the February market turbulence, the Hypothetical Model Portfolio is outperforming the S&P 500 Index by about 0.57%.


*The Hypothetical Model Portfolio was created with an investment of $100,000 in securities as of the closing values on December 30, 2005 and an additional $25,000 was invested n securities as of the closing values on December 29, 2006. The reason why the total cost in the chart is greater than $125,000 is because the total cost accounts for the value of distributions reinvested into the mutual funds in the portfolio.

January 2007 Returns

Sunday, February 11, 2007

January 2007 Returns For My Model Long-Term Portfolio

January 2007 was decent month for my Hypothetical Model Portfolio, despite trailing the broader market returns. As of the market close on January 31, 2007, the Hypothetical Model Portfolio* increased in value by $1769.52, or about 1.22% during the month of January. The Hypothetical Model Portfolio has now gained a total of $22,246 since it was created in January 2006 with $100,000 and an additional $25,000 was added at the beginning of 2007.

Midcaps led the way during January, with the Vanguard Mid Cap Index Fund (VIMSX) rising about 3.65%. It would be nice if midcaps have a strong year in 2007, as they trailed the S&P 500 by about two percentage points during 2006. The next strongest performers in the portfolio were small caps and tech stocks. The Vanguard Small Cap Index (NAESX) rose about 2.40%, the Vanguard Small Cap Value Index (VISVX) rose about 2.01%, and the Nasdaq 100 ETF (QQQQ) rose about 2.11%.

The weakest returns were turned in by the Templeton Russia closed-end fund (TRF) and the iShares Emerging Markets ETF (EEM). TRF plummeted about 15.12% and EEM rose a paltry 0.11%. The Russia stock market was steady during January and the value of the Russian and Eastern European stocks held by TRF was also steady. However, as I have discussed previously, closed-end funds typically trade at a variable premium or discount to their underlying Net Asset Value ("NAV"). According to ETF Connect, TRF traded at a 38.07% premium to its NAV at the end of December 2006 and at a 17.63% premium on January 31, 2007. TRF has traded at an average premium of around 10-15% since its inception in 1995 so TRF's premium compression is probably about over for now. If Russian and Eastern European stocks perform well this year TRF should provide another solid year of returns.

TRF paid a distribution of $566.33 on January 16, 2007. This distribution was declared at the end of December 2006 and I listed this as a "pending distribution" in the portfolio chart for December. As I mentioned in my earlier post regarding my 2007 portfolio rebalancing, this distribution was reinvested in the Vanguard mutual funds in the portfolio because these funds do not charge a transaction fee. On January 17, 2007, the following purchases were made with this distribution:
  • Vanguard Index 500 mutual fund (symbol: VFINX): 1.262 shares at $131.81/share, a total investment of $166.33
  • Vanguard Midcap Index mutual fund (symbol: VIMSX): 4.970 shares at $20.12/share, a total investment of $100.00
  • Vanguard Developed Markets Index mutual fund (symbol: VDMIX): 7.930 shares at $12.61/share, a total investment of $100.00
  • Vanguard Small Cap Index mutual fund (symbol: NAESX): 3.045 shares at $32.84/share, a total investment of $100.00
  • Vanguard Small Cap Value Index mutual fund (symbol: VISVX): 5.862 shares at $17.06/share, a total investment of $100.00


*The Hypothetical Model Portfolio was created with an investment of $100,000 in securities as of the closing values on December 30, 2005 and an additional $25,000 was invested n securities as of the closing values on December 29, 2006. The reason why the total cost in the chart is greater than $125,000 is because the total cost accounts for the value of distributions reinvested into the mutual funds in the portfolio.

December 2006 Returns

Sunday, February 04, 2007

Updated Model Long-Term Portfolio For 2007

As I mentioned in my post discussing the December 2006 returns for my Hypothetical Model Portfolio, I have added another $25,000 to this portfolio. This money is allocated according to the original portfolio allocation discussed in my January 2006 post regarding the creation of this portfolio. In short, this money is being added to rebalance the portfolio. My rules of rebalancing are that I will not sell any of the holdings, although I am allowed to purchase additional shares. Although this is a purely hypothetical portfolio, I have attempted to make this as realistic as possible and do account for trading commissions that would normally be incurred. In my portfolio, commissions would be incurred when purchasing any of the ETFs or the closed end fund. There are no commissions, on the other hand, for purchasing additional shares of any of the Vanguard index-tracking mutual funds.

As discussed in my last post, the portfolio included $739.97 in CASH (from dividends and capital gains distributions). Accordingly, a total of $25,739.97 is being re-invested at this time. I am not reinvesting the $566.33 in pending distributions for the Templeton Russia Fund (symbol: TRF) because it had not yet been distributed as of the start of 2007. The purchases of the securities in the portfolio were made as of their respective closing prices on December 29, 2006, the last trading day of 2006.

The portfolio includes a total of ten securities and I have purchased shares of nine of the securities in this rebalancing. TRF is the only security for which I did not add additional shares. TRF substantially outperformed the portfolio last year and is actually still overweighted in the portfolio despite the additional of new money.

The following purchases are made with the $25,739,97 I had to invest:
  • Vanguard Index 500 mutual fund (symbol: VFINX): 48.151 shares at $130.59/share, a total investment of $6288.04
  • Vanguard Midcap Index mutual fund (symbol: VIMSX): 242.719 shares at $19.78/share, a total investment of $4800.99
  • Vanguard Developed Markets Index mutual fund (symbol: VDMIX): 188.190 shares at $12.58/share, a total investment of $2367.43
  • Vanguard Small Cap Index mutual fund (symbol: NAESX): 105.816 shares at $32.62/share, a total investment of $3451.71
  • Vanguard Small Cap Value Index mutual fund (symbol: VISVX): 177.484 shares at $17.05/share, a total investment of $3026.11
  • iShares Emerging Market Index ETF (symbol: EEM): 11 shares at $114.17/share + $5 commission (through Ameritrade Izone), a total investment of $1260.87
  • Nasdaq 100 ETF (symbol: QQQQ): 56 shares at $43.16/share + $5 commission, a total investment of $2421.96
  • iShares Dow Jones U.S. Select Dividend Index ETF (symbol: DVY): 20 shares at $70.74/share + $5 commission, a total investment of $1419.80
  • SPDR Financial components ETF (symbol: XLF): 19 shares at $36.74/share + $5 commission, a total investment of $703.06
As discussed in my January 2006 post introducing the Model Long-Term Portfolio, my desired model portfolio allocation is as set forth below (After rebalancing, the portfolio percentages are closer to the desired model portfolio allocation than they were at the end of December 2006. However, it was not possible the exactly match the model portfolio allocation because of TRF's substantial outperformance in 2006. ):

22.000% VFINX
15.700% VIMSX
12.950% VDMIX
12.075% VISVX
12.075% NAESX
8.050% EEM
6.250% QQQQ
4.900% DVY
3.500% TRF
2.500% XLF

The model portfolio after rebalancing is shown in the chart below (click on the image for a larger view)**:


* I have decided that because I am going to add an additional $25,000 at the end of each year to this portfolio, I will reinvest the dividends and distributions from the ETFs and the closed end fund immediately after they are distributed. I will only reinvest this money into the Vanguard index-tracking mutual funds because Vanguard does not charge commissions. The minimum investment for the Vanguard mutual funds is $100, so I will wait until at least $100 has accumulated before reinvesting the dividends and capital gains distributions.

**The total cost of all of the securities in the model portfolio is greater than the total of $125,000 that I initially added (i.e., $100,000 in 2006 and $25,000 in 2007) because $2,168.33 in dividends and capital gains distributions were reinvested. When purchasing new shares with such dividends and capital gains distributions, I added the amount purchased into the "cost" column of the chart shown above. The reason why I did this is because this is how one would need to account for such purchases on a taxable basis, so it makes sense to account for them the same way in this model portfolio.

***The Model Portfolio returned 20.50% in 2006. The way I calculated this was by dividing the $20,476 portfolio gain by $100,000, the total amount initially invested. However, because I added $25,000 in new money to the portfolio, the overall return decreased to 16.38% ($20,476 divided by $125,000) in the chart shown above.

Monday, January 01, 2007

December 2006 Returns For My Model Long-Term Portfolio

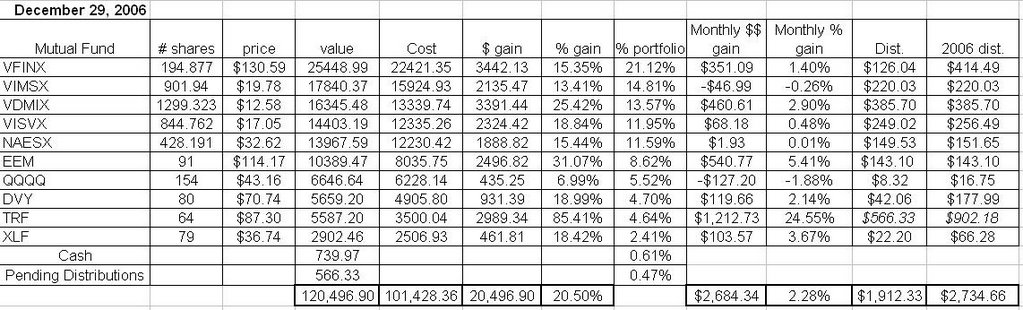
December was yet another solid month for my Hypothetical Model Portfolio. As of the market close on December 29, 2006, the Hypothetical Model Portfolio* increased in value by $2684.34, or about 2.28% during the month of December. The Hypothetical Model Portfolio closed up $20,496.90 in 2006, a gain of about 20.50%, as shown on the table below (click for a larger image of the table).

Emerging markets led the way in December and were the overall winners in my portfolio for the 2006-year. The Templeton Russia closed-end fund (TRF) rose over 24% in December and finished 2006 up a whopping 85%, and the iShares Emerging Markets ETF (EEM) returned about 5.4%, finishing the year up just over 31%. My third-best performer in 2006 was the Vanguard Developed Markets Index mutual fund (VDMIX), which rose about 2.9% in December and finished 2006 up about 25.4%. Dividend-paying stocks also performed well during December, with S&P 500 Financial components ETF (XLF) returning about 3.6% and the iShares Dow Jones U.S. Select Dividend Index Fund (DVY) rising about 2.1%.

As discussed above, the foreign holdings (i.e., TRF, EEM, and VDMIX) powered the portfolio during 2006. The only real dog of the portfolio was the Nasdaq 100 ETF (QQQQ), which rose just under 7% during 2006, trailing the overall performance of the portfolio by about 13.5%.

Nine of the ten holdings in the portfolio paid distributions during December. TRF was the only holding to not pay a distribution. However, distributions were deducted from the share price for TRF at the end of December. The TRF distributions will be paid out during the middle of January. Because the distribution is large (greater than $500), I have included the January 2007 TRF distributions in the December 2006 returns for TRF and labeled them "pending distributions."

Regarding the rest of the holdings, the dividends from mutual fund holdings were reinvested, but the dividends from the ETFs were not reinvested- they were accumulated as "CASH" on the performance table below, for the reasons set forth in a previous post. The Vanguard S&P 500 Index fund (VFINX) paid a dividend of $0.65/share (a total of $126.04), which was reinvested on December 27th to purchase an additional 0.966 shares at a price of $130.43/share. The Vanguard Mid Cap Index Fund (VIMSX) paid a dividend of $0.247/share (a total of $220.03), which was reinvested on December 22nd to purchase an additional 11.135 shares at a price of $19.76/share. The Vanguard Developed Markets Index mutual fund (VDMIX) paid a dividend of $0.299/share and a short-term capital gain of $0.005/share (a total of $385.70), which was reinvested on December 29th to purchase an additional 30.563 shares at a price of $12.62/share. The Vanguard Small Cap Value Index (VISVX) paid a dividend of $0.30/share (a total of $249.02), which was reinvested on December 22nd to purchase an additional 14.709 shares at a price of $16.93/share. The Vanguard Small Cap Index (NAESX) paid a dividend of $0.353/share (a total of $149.53), which was reinvested on December 22nd to purchase an additional 4.604 shares at a price of $32.48/share.

The ETFs listed below each paid a distribution that was invested in "CASH" as shown in the chart below. EEM paid a dividend of $1.57251/share (a total of $143.10) on December 29th. QQQQ paid a dividend of $0.054/share (a total of $8.32) on December 29th. DVY paid a dividend of $0.52572/share (a total of $42.06) on December 27th. XLF paid a dividend of $0.28103/share (a total of $22.20) on December 27th. Finally, a distribution of $8.8489 was deducted from the TRF share price on December 27th and will be paid on January 16, 2006.

My Hypothetical Model Portfolio beat the S&P 500 index by about 5 percentage points during 2006. This is an impressive performance. I concede that the Hypothetical Model Portfolio will underperform the S&P 500 index from time-to-time, but it should outperform the S&P 500 index over the long-term. For the 2007 investing year, I intend to add another $25,000 to the Hypothetical Model Portfolio and invest this money and the money listed as "CASH" below according to the same allocations as were outlined in my original post in which I introduced my Hypothetical Model Portfolio. I will discuss the purchase of new shares in a subsequent post.

*The Hypothetical Model Portfolio was hypothetically created with an investment of $100,000 with investments made as of the closing values on December 30, 2005. The reason why the total cost in the chart is greater than $100,000 is because the total cost accounts for the value of dividends reinvested into the mutual funds in the portfolio.


November 2006 Returns

Thursday, December 07, 2006

November 2006 Returns For My Model Long-Term Portfolio

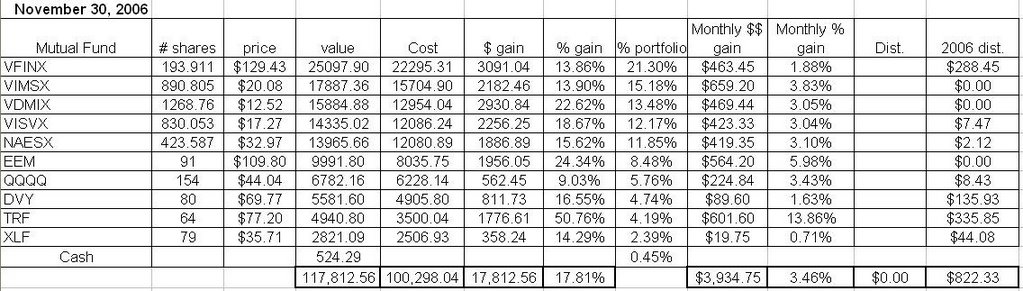
November was another great month for my Hypothetical Model Portfolio. As of the market close on November 30, 2006, the Hypothetical Model Portfolio* increased in value by $3934.75, or about 3.46% during the month of November. The Hypothetical Model Portfolio is now up $17,812.56 in 2006, a gain of 17.81%, as shown on the table below (click for a larger image of the table).

Emerging markets led the way in November, with the Templeton Russia closed-end fund (TRF)appreciating about 13.86% and the iShares Emerging Markets ETF (EEM) returning about 5.98%. Mid caps, small caps, and tech stocks were also strong performers. The Vanguard Mid Cap Index (VIMSX), the Vanguard Small Cap Index (NAESX), Vanguard Small Cap Value Index (VISVX), and the Nasdaq 100 ETF (QQQQ) rose 3.83%, 3.04%, 3.10%, and 3.43%, respectively. The only other ETF or fund to return more than 3% in November was the Vanguard Developed Markets Index mutual fund (VDMIX), which returned about 3.83%. (VDMIX tracks the broad-based foreign stock MSCI EAFE index.)

The poorest portfolio performers in November were my holdings that invest in stocks of large cap companies and dividend-focused ETFs. The Vanguard Index 500 fund (VFINX), S&P 500 Financial components ETF (XLF), and iShares Dow Jones U.S. Select Dividend Index Fund (DVY) returned 1.88%, 1.63%, and 0.71%, respectively.

The stock market continues to look strong as 2006 comes to an end. With a slight surge in December, my Hypothetical Model Portfolio can close the year up 20%.

*The Hypothetical Model Portfolio was hypothetically created with an investment of $100,000 with investments made as of the closing values on December 30, 2005. The reason why the total cost in the chart is greater than $100,000 is because the total cost accounts for the value of dividends reinvested into the mutual funds in the portfolio.


October 2006 Returns

Wednesday, November 08, 2006

October 2006 Returns For My Model Long-Term Portfolio

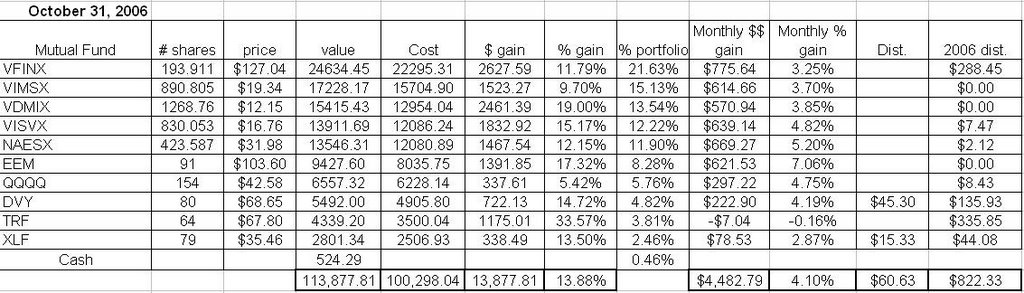
October was a great month from my Hypothetical Model Portfolio. As of the market close on October 31, 2006, the Hypothetical Model Portfolio* increased in value by $4482.79, or about 4.10% during the month of October. The Hypothetical Model Portfolio is now up $13,877.81 in 2006, a gain of 13.88%, as shown on the table below (click for a larger image of the table).

The iShares Emerging Markets ETF (EEM) led the portfolio higher, returning 7.06% for the month. Small caps and tech stocks were also strong performers. The Vanguard Small Cap Index (NAESX), Vanguard Small Cap Value Index (VISVX), and Nasdaq 100 ETF (QQQQ) rose 5.20%, 4,82%, and 4.75%, respectively.

The only laggards during October were the S&P 500 Financial components ETF (XLF) and the Templeton Russia closed-end fund (TRF) , returning 2.87% and losing 0.16%, respectively.

Two of my holdings paid dividends during October. As I mentioned in a previous post, the dividends from mutual fund holdings are reinvested, but the dividends from ETFs or the closed end fund (i.e., the Templeton Russia closed-end fund (TRF)) are not reinvested- they will accumulate as "CASH" on the performance table below. The iShares Dow Jones U.S. Select Dividend Index Fund (DVY) paid a dividend of $0.5662 (a total of $45.30 ), and XLF paid a dividend of $0.194/share (a total of $15.33).

Stocks look good heading toward the end of 2006. With a strong finish during November and December, my Hypothetical Model Portfolio could close the year up 15-20%.

*The Hypothetical Model Portfolio was hypothetically created with an investment of $100,000 with investments made as of the closing values on December 30, 2005. The reason why the total cost in the chart is greater than $100,000 is because the total cost accounts for the value of dividends reinvested into the mutual funds in the portfolio.


September 2006 Returns

Monday, October 02, 2006

September 2006 Returns For My Model Long-Term Portfolio

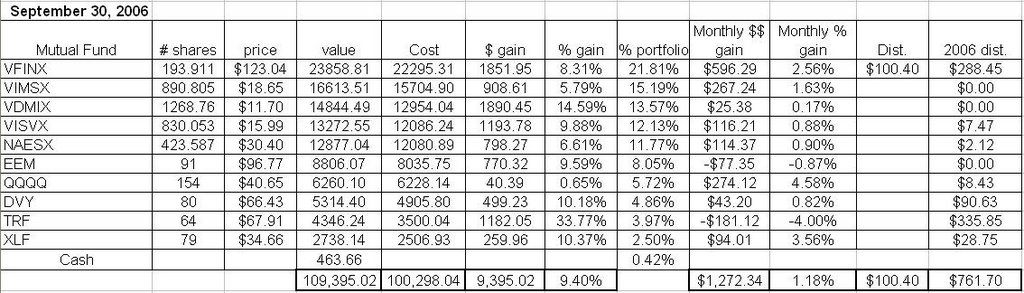
My Hypothetical Model Portfolio had decent returns during the month of September. As of the market close on September 29, 2006, the Hypothetical Model Portfolio* increased in value by $1272.34, or about 1.18% during the month of September. The Hypothetical Model Portfolio is now up $9395.02 in 2006, a gain of 9.40%, as shown on the table below (click for a larger image of the table).

The portfolio was strong throughout the month. Tech stocks led the way for the second straight moneth, with the Nasdaq 100 ETF (QQQQ) rising 4.58%. The second biggest winner (on a percentage basis) was the S&P 500 Financial components ETF (XLF), which appreciated by 3.56%. Large cap stocks also performed very well - the Vanguard S&P 500 Index fund (VFINX) rose about 2.56%.

Small caps and international stocks were laggards during September, possibly due to a stronger U.S. dollar. The Templeton Russia closed-end fund (TRF) and
the iShares Emerging Markets ETF (EEM) both posted negative returns, falling about 4.00% and 0.87%, respectively. Other dogs include the Vanguard Developed Markets Index fund (VDMIX), the Vanguard Small Cap Value Index (VISVX), and the Vanguard Small Cap Index (NAESX) which rose just 0.17%, 0.88%, and 0.90%, respectively.

One of the holdings in my Hypothetical Model Portfolio, VFINX, paid dividends during Septmember. As I mentioned in a previous post, the dividends from mutual fund holdings are reinvested, but the dividends from ETFs or the closed end fund (i.e., the Templeton Russia closed-end fund (TRF)) are not reinvested- they will accumulate as "CASH" on the performance table below. VFINX paid a dividend of $0.52/share (a total of $100.40) which was reinvested on September 22 to purchase an additional 0.829 shares at a price of $121.08/share.

I was glad to see decent returns in August. Hopefully stocks will perform well during the 4th quarter of 2006 so that my Hypothetical Model Portfolio will end 2006 up 10-15%.

*The Hypothetical Model Portfolio was hypothetically created with an investment of $100,000 with investments made as of the closing values on December 30, 2005. The reason why the total cost in the chart is greater than $100,000 is because the total cost accounts for the value of dividends reinvested into the mutual funds in the portfolio.

Monday, September 18, 2006

August 2006 Returns For My Model Long-Term Portfolio

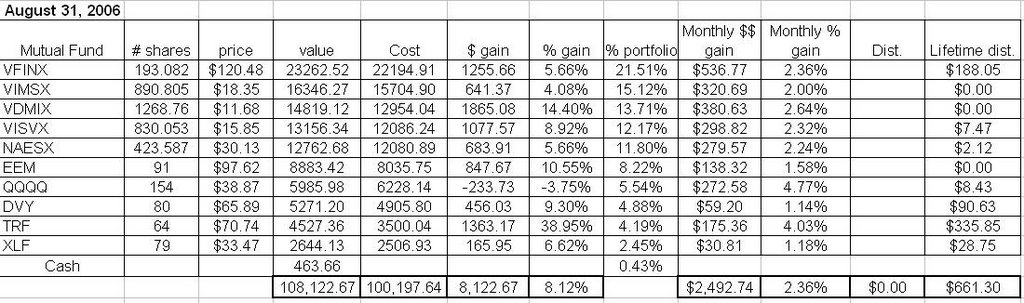
My Hypothetical Model Portfolio experienced its strongest month since April. As of the market close on August 31, 2006, the Hypothetical Model Portfolio* increased in value by $2492.74, or about 2.36% during the month of August. The Hypothetical Model Portfolio is now up $8122.67 in 2006, a gain of 8.12%, as shown on the table below (click for a larger image of the table).

The portfolio rallied toward the end of the month to show the impressive August returns. Tech stocks led the way, with the Nasdaq 100 ETF (QQQQ) rising 4.77%. The second biggest winner (on a percentage basis) was the Templeton Russia closed-end fund (TRF), which increased in value by about 4.03%, bringing its total return for 2006 through August 31st to an impressive 38.95%. Other solid performers included the Vanguard Developed Markets Index fund (VDMIX) and the Vanguard S&P 500 Index fund (VFINX), which returned about 2.64% and 2.36%, respectively, during August.

Dividend-paying stocks and the emerging markets were the laggards last month. The iShares Dow Jones U.S. Select Dividend Index Fund (DVY), the S&P 500 Financial components ETF (XLF), and the iShares Emerging Markets ETF (EEM) had sub-par returns of about 1.14%, 1.18%, and 1.58%, respectively. I suppose this was to be expected, as these three ETFs were the top performers in July.

I was glad to see QQQQ finally show some decent returns in August. It was bound to happen sooner or later. QQQQ is still down about 3.75% on the year, but I suspect we'll see tech stocks rally through the last quarter of 2006.

*The Hypothetical Model Portfolio was hypothetically created with an investment of $100,000 with investments made as of the closing values on December 30, 2005. The reason why the total cost in the chart is greater than $100,000 is because the total cost accounts for the value of dividends reinvested into the mutual funds in the portfolio.

Thursday, August 03, 2006

July Returns For My Model Long-Term Portfolio

My Hypothetical Model Portfolio was slightly down during July. As of the market close on July 31, 2006, the Hypothetical Model Portfolio* decreased in value by $598.54, or about 0.56% during the month of July. The Hypothetical Model Portfolio is up $5629.93 in 2006, a gain of 5.63%, as shown on the table below (click for a larger image of the table).

The portfolio was down substantially earlier in July before recovering strongly near the end of the month. This choppy performance is similar to what happened during June 2006. Tech stocks continued to struggle during July, resulting in a drop of 4.24% in the Nasdaq 100 ETF (QQQQ). The second biggest losss (on a percentage basis) was the Vanguard Small Cap Index (NAESX) which dropped 3.31% during July. The other big losers were the Vanguard Midcap Index (VIMSX) which fell 2.28% and the Templeton Russia closed-end fund (TRF) which dropped 2.24%.

On a positive note, large caps and dividend paying stocks performed well in July. The iShares Dow Jones U.S. Select Dividend Index Fund (DVY) and the S&P 500 Financial components ETF (XLF) returned 3.31% and 3.06%, respectively. Other top performers include the Emerging Markets ETF (EEM) and the Vanguard Developed Markets Index (VDMIX), which returned 2.34% and 1.16%, respectively.

Two of the holdings in my Hypothetical Model Portfolio paid dividends in July. As I mentioned in a previous post, the dividends from mutual fund holdings are reinvested, but the dividends from ETFs or the closed end fund (i.e., the Templeton Russia closed-end fund (TRF)) are not reinvested- they will accumulate as "CASH" on the performance table below.

XLF paid a dividend of $0.187 on July 31 (a total of $14.77) which was moved to "CASH" on the table shown below. QQQQ paid a dividend of $0.0257/share on July 31 (a total of $3.96) that was also moved to "CASH" on the table below. Accordingly, the value of accumulated and uninvested distributions is now up to $463.66.

The Hypothetical Model Portfolio's performance was not bad during July. The main thing holding it back was the poor return of tech stocks which dragged down QQQQ. Tech stocks have been out of favor with investors for 6+ years after so many got burned holding them when the bubble burst in 2000. Eventually investors will warm to tech again. I don't know when that will happen, but rest assured that it will eventually happen. That is why I included QQQQ in my Hypothetical Model Portfolio. I still firmly believe that this portfolio will outperform the major stock market averages over time.

*The Hypothetical Model Portfolio was hypothetically created with an investment of $100,000 with investments made as of the closing values on December 30, 2005. The reason why the total cost in the chart is greater than $100,000 is because the total cost accounts for the value of dividends reinvested into the mutual funds in the portfolio.

Friday, July 07, 2006

June Returns For My Model Long-Term Portfolio

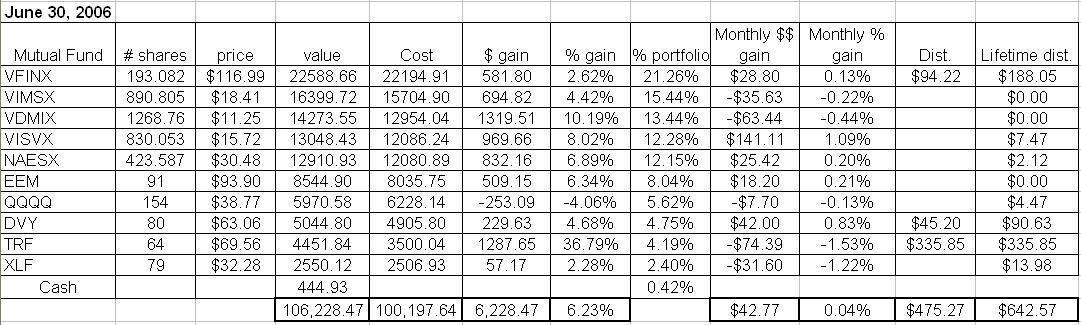
The performance of my Hypothetical Model Portfolio was flat during June. As of the market close on June 30, 2006, the Hypothetical Model Portfolio* increased in value by $42.77, or about 0.04% during June. The Hypothetical Model Portfolio is up $6228.47in 2006, a gain of 6.23%, as shown on the table below (click for a larger image of the table).

The portfolio was down substantially (bottoming near a loss of about $6,000) through most of the first half of June before recovering strongly near the end of the month to finish flat.
The Templeton Russia closed-end fund (TRF) continued to struggle, finishing with a loss of 1.53% for the month after being down about 30% for the month as of June 13th. The second-worst performer was the SPDR Financial components (XLF) which fell 1.22%.

On a positive note, my small cap holdings performed well. The Vanguard Small Cap Value Index (VISVX) was my top performer, returning 1.09% in June. The Vanguard Small Cap Index mutual fund (NAESX) was also positive, returning 0.20%. The Emerging Markets ETF (EEM) was another positive performer, recovering from a disastrous May by returning a respectable a respectable 0.21% in June. The iShares Dow Jones U.S. Select Dividend Index Fund (DVY) also performed well, returning 0.83% during June.

Four of the holdings in my Hypothetical Model Portfolio paid dividends in June. As I mentioned in a previous post, the dividends from mutual fund holdings are reinvested, but the dividends from ETFs or the closed end fund (i.e., the Templeton Russia closed-end fund (TRF)) are not reinvested- they will accumulate as "CASH" on the performance table below. The reason I am doing this is because the index mutual funds in this portfolio do not charge a transaction fee for reinvesting dividends. To reinvent dividends for any of the ETFs or TRF, on the other hand, would cause me to incur transaction fees for the trading commissions.

The Vanguard S&P 500 index fund (VFINX) paid a dividend of $0.49/share (a total of $94.22) which was reinvested on June 23 to purchase an additional 0.805 shares at a price of $116.99/share. DVY paid a dividend of $0.56501 on June 28 (a total of $45.20) which was moved to "CASH" on the table shown below. TRF paid a long-term distribution of $5.2476/share on June 19 (a total of $335.85) that was also moved to "CASH" on the table below.

The economy continues to hum along despite the FED interest rate increases. I suspect that the FED will raise rates a couple more times and then be done with it. Hopefully the market will finally surge at that time.

*The Hypothetical Model Portfolio was hypothetically created with an investment of $100,000 with investments made as of the closing values on December 30, 2005. The reason why the total cost in the chart is greater than $100,000 is because the total cost accounts for the value of dividends reinvested into the mutual funds in the portfolio.

Monday, June 05, 2006

May Returns For My Model Long-Term Portfolio

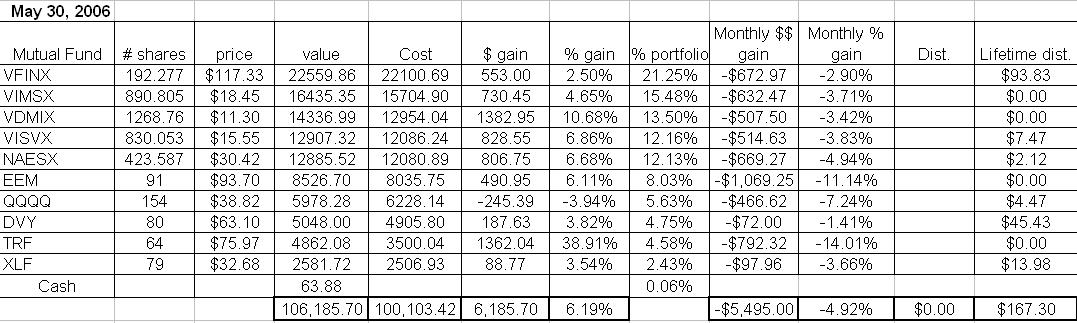
My Hypothetical Model Portfolio performed very poorly in May. As of the market close on May 30, 2006, the Hypothetical Model Portfolio* dropped $5,495, or 4.92% during May. However, the Hypothetical Model Portfolio is still up $6185.70 in 2006, a gain of 6.19%, as shown on the table below (click for a larger image of the table).

Every one of the holdings went down, as May was a horrible month for stock market investors across the board. Foreign holdings were my worst performers in April, with the Templeton Russia closed-end fund (TRF) plummeting 14.01% and the Emerging Markets ETF (EEM) dropping 11.14%. Despite these huge drops, TRF and EEM are still up 38.91% and 6.11%, respectively, in 2006. My two best performers were the iShares Dow Jones U.S. Select Dividend Index Fund (DVY) and Vanguard S&P 500 index fund (VFINX) which dropped 1.41% and 2.90%, respectively.

I suspect that the ugly May results do not represent anything other than a correction. The U.S. economy is still humming along and the FED will probably stop raising rates sometime soon. The Hypothetical Model Portfolio is still on pace for a solid 15.5% total return in 2006 even after the May correction.

*The Hypothetical Model Portfolio was hypothetically created with an investment of $100,000 with investments made as of the closing values on December 30, 2005. The reason why the total cost in the chart is greater than $100,000 is because the total cost accounts for the value of dividends reinvested into the mutual funds in the portfolio.