Friday, December 30, 2005

Small Cap Value stocks outperform Large Cap Growth stocks

Small Cap Value stocks comprise one of the best (if not the best) performing types of stocks for the long haul. As you probably remember, between 1995 and 1999, Large Cap Growth stocks were all the rage and Small Cap Value stocks were shunned like an ugly step-sister. However, since 2000, Small Cap Value stocks have outperformed their Large Cap Growth peers by over 100%.

I performed a little bit of Internet research and discovered that between 1926 and 2004, Large cap Growth stocks had an average annual return of about 9.26%. Accordingly, $10,000 invested in Large Cap Growth stocks in 1926 would have grown to about $10 million by 2004. That's not too shabby. However, it pales in comparison to the astonishing 15.9% annual return of Small Cap Growth stocks over the same time period. $10,000 invested in Small Cap Value stocks in 1926 would have grown to about $1 billion by 2004!

Here's an illustration of these returns that was in the New York Times last year:


For those interested in investing in Small Cap Value stocks, I recommend the Vanguard Small Cap Value index fund (symbol: VISVX) or the corresponding Vanguard ETF (symbol: VBR).

Tuesday, December 20, 2005

"Periodic Table" of equity style investment returns from 1985-2004

I recently found a "Periodic Table" of equity style investment returns from 1985-2004. The Periodic Table lists the annual returns for various types and styles of equity investments during the 1985-2004 time frame, as shown below. Specifically, annual returns are included for the following types and styles of equity investments: (a) S&P 500; (b) S&P/Barra 500 Growth; (c) S&P/Barra 500 Value; (d) Russell 2000; (e) Russell 2000 Value; (f) Russell 2000 Growth; (g) MSCI EAFE; and (h) the Lehman Brothers Aggegrate Bond index. (Click on the image below to see a larger version of the Periodic Table.)


*** I have written a new post with results from 1989-2008.

Friday, December 16, 2005

Pfizer raised its quarterly dividend by 26% this week!

Early this week, Pfizer announced that it was raising its quarterly dividend by 26%, from 19 cents per share to 24 cents per share. With Pfizer currently trading at about $22.70 per share, its annual dividend payouts will be 96 cents, giving it a dividend yield of just over 4.2%! Even though Pfizer's stock (symbol: PFE) is trading around where it was in 1997, its forward PE is a mere 11, about than 1/5 of what it was in 1998.

Even if Pfizer's earnings don't accelerate in the next couple of years, it is still the 800-lb gorilla of the drug industry, generating billions of dollars in free cash flow and spending upwards of $7 billion on R&D annually. If nothing else, its dividend makes Pfizer look extremely attractive to me. Also, Pfizer has a long history of raising its divdends each year, so the annual dividend payouts should keep rising every year.

I think Pfizer's a steal at just $22.70 per share.

Thursday, December 15, 2005

The Templeton Russia & East European Fund

A couple weeks ago I wrote a post about how closed end funds are the best way for small investors to invest in certain foreign markets such as Russia and India, countries for which no country-specific ETF currently exist. Anyway, I decided to look at some statistics for the Templeton Russia & East European Fund today at ETF Connect, when I noted that the fund's average annualized 5-year return through the end of Nov. 2005 is 44.15%! That works out to an ubelievable total gain of about 522% over the past 5 years. I find that to be absolutely astounding. At the end of October I purchased shares of this fund for my Rollover IRA. Too bad I didn't purchase shares way back in 2000...

Friday, December 09, 2005

The MSCI EAFE index is the "S&P 500" of foreign stocks

ETFs and mutual funds investing in foreign stocks have become increasing popular over the past 3 years or so. For example, the iShares Morgan Stanley Capital International, Inc. ("MSCI") Europe, Australasia Far East ("EAFE") index ETF (symbol: EFA) has attracted some $20 billion+ in assets in just a few years, while the MSCI Emerging Markets index ETF (symbol: EEM) has attracted around $7 billion in assets since its inception in April 2003.

The MSCI EAFE index is the less volatile of the two. The MSCI EAFE index tracks the stocks of foreign developed markets. Accordingly, these stocks should be less succeptible than emerging markets stocks to currency devauations, lawlessness, etc.

Its assets are divided between a number of European, Asian, and Australian stocks. As of the end of June 2005, close to 25% of its assets were invested in UK stocks, 21% were invested in Japanese stocks, 9% were in French stocks, close to 7% were in German stocks, another 7% were in Swiss stocks, and close to 6% were in Australian stocks.

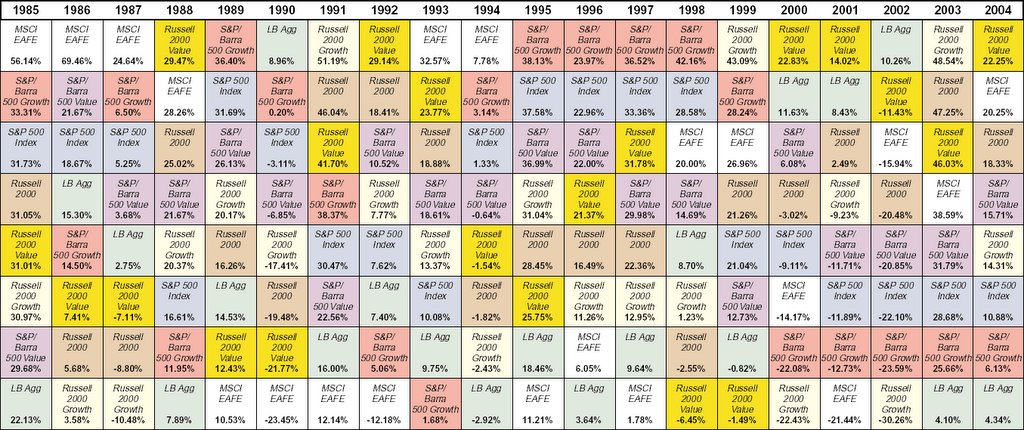
The MSCI EAFE index has slightly outperformed the S&P 500 over the past 10 years, returning about 1% more annually over the past 10 years. We've been hearing much about the inevitable decline of the U.S. dollar relative to foreign currencies lately. In the event that does eventually happen, there's a strong likelihood that foreign stocks will outperform domestic ones. Accoridngly, an ETF or mutual fund tracking the MSCI EAFE index is a good addition to an investor's portfolio.

For those who enjoy dollar-cost-averaging, ETFs may not be the best investment vehicle, seeing as how commissions must be paid to acquire the shares on a stock market exchange. Luckily, however, Vanguard offers a low-cost index fund, the Vanguard Developed Markets Index fund, that tracks this index. The Vanguard fund has a low expense ratio of about .29%.

Monday, December 05, 2005

Closed-end funds are the best way for the common man to invest in Russia and India

There's been a lot of talk over the past few years about the benefits of investing in Exchange Traded Funds ("ETFs"). Financial writers and advisors tout their tax efficiency, low cost, and instant diversification as several reasons to buy.

Unfortunately, there are a number of market segments for which no good ETFs currently exist. Those include some emerging foreign markets such as Russia and India. Both Russia and India are supposed to be two of the fastest growing economies over the next several decades. It would be nice if there was an ETF that would invest in stocks in each of these countries. Unfortunately, acording to ETFconnect, there is no such ETF right now. However, there are a couple closed-end funds investing in each of these markets.

The best Russian stock market closed-end fund that I've found is the Templeton Russia and East European Fund (ticker symbol: TRF). This fund has been around since 1995 and returned an annualized 20.10% for the 10-year period ending on 10/31/05. However, this fund is not for the faint of heart - although it has had huge gains, such as in 1999 when it gained 133.57%, it has also had huge losses, such as in 1998 when it lost 74.65% when Russia had a currency crisis.

The best Indian stock market closed-end fund that I've found is the Morgan Stanley India Investment Fund (ticker symbol: IIF). This fund has been around since 1994 and returned an annualized 19.09% for the 10-year period ending on 10/31/05. However, this fund is also very volatile - it returned 144% in 1999 after losing 11% and 14% in 1997 and 1998, respectively.

As with all closed-end funds, these do charge higher fees than most ETFs - usually over 1% of assests. Moreover, closed-end fund can also trade at a discount to their underlying net asset values.

***Update - August 7, 2007***
Since I wrote this article back in 2005, a low cost Russia stock market ETF and an India stock market ETN have been introduced. I discussed both the Russia stock market ETF and the India stock market ETN in 2007 posts.

Thursday, December 01, 2005

Powershares has a wide assortment of interesting ETFs

I first heard about the Powershares brand of Exchange Traded Funds (ETFs) about a year ago. Powershares is an investment company that provides a wide assortment of ETFs that track various segments of the stock market and attempt to beat their peer ETFs and mutual funds.

Most of their ETFs track various "Intellidex" indicies. Intellidex indicies track market segments such as Small Cap Value, OTC stocks, and the market as a whole. Powershares doesn't divulge the intellidex parameters, but it does publish a list of the stocks in each of their ETFs on the Powershares website.

My personal favorites are the SmallCap Value, OTC, and Dynamic Market ETFs. Accordingly to Powershares, the SmallCap Value Intellidex has returned 19.49% annually over the past 10 years and 24.18% annually over the past 5 years. The website indicates that the intellidex for the Dynamic Market ETF (which is designed to beat the S&P 500) has returned 15.26% annually over the past 10 years and 9.04% annually over the past 5 years. The website further indicates that intellidex for the Dynamic OTC ETF (which attempts to beat the Nasdaq composite) has returned 16.45% annually over the past 10 years and 1% annually over the past 5 years.