Thursday, August 31, 2006

Historical Dividends for the S&P 500

Dividends are crucial to any long-term investor's portfolio. During extended bear markets they often provide the only positive returns to the investor. I have often wondered about the long-term historical dividend increases of various stock indices, such as the S&P 500 index, but have had difficulty finding information going back more than 20 years or so. Luckily, however, I discovered an article concerning historical dividend growth and stock valuations between 1871 and 2003. This article is entitled "Dividends and Stock Valuation: A Study From the Nineteenth to the Twenty-First Century".

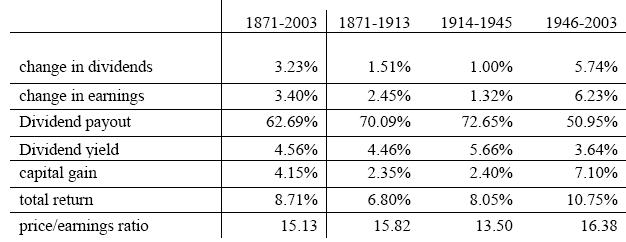
This article provides various data which it purports to relate to dividends and valuations for the S&P 500 dating back to 1871.* As shown in the chart below, dividends increased an average of 3.23% per year between 1871 and 2003. However, this average increase was not uniform. The chart below divides the dividend increases into three periods: (a) 1871-1913, (b) 1914-1945, and (c) 1946-2003. Between 1871 and 1913, dividends increased an average of 1.51% annually, between 1914 and 1945 they increased about 1.00% annually, and between 1946 and 2003 they increased an average of 5.74% annually. The dividend increases have accelerated further since 2003, as discussed in a previous post.

The annual dividend increases since 1946 have been very impressive. This highlights the reason why I am a strong believer that dividend-paying stocks should comprise a portion of every investor's portfolio. In fact, I believe that dividend-paying stocks are far more attractive than bonds for young investors (e.g., investors under 35 or 40 who will likely participate in the workforce for 20+ more years) for several reasons.

First, dividend income is generally taxable at a maximum rate of 15% a year as opposed to bond payouts which are generally taxed as ordinary income (i.e., at a tax rate of up to 35% for an individual). Second, dividend-paying stocks offer a great potential for capital gains not provided by bonds. For example, in the event that the earnings for the companies paying dividends keep increasing, there is a likelihood that their associated stock prices will also rise and that their dividend payouts will increase accordingly. Bonds, on the other hand, pay the same interest payout amounts year-after-year.

Finally, dividend-paying stocks provide some protection against inflation that bonds necessarily cannot provide. The prevailing view holds that as inflation heats up companies raise prices and the revenue from the inflated prices is reflected as increased company earnings. As earnings increase, the corresponding stock prices and dividends generally increase accordingly, as discussed above. However, during such inflationary periods, bonds become less valuable. For example, a 5% payout may be attractive when inflation is running at 1% per year, but are far less attractive when inflation accelerates to 6% per year.


*This data cannot be correct, however, as the S&P 500 index was only created in or around 1923. I presume that the data prior to 1923 must have come from a similar index of large-cap stocks.

Thursday, August 03, 2006

July Returns For My Model Long-Term Portfolio

My Hypothetical Model Portfolio was slightly down during July. As of the market close on July 31, 2006, the Hypothetical Model Portfolio* decreased in value by $598.54, or about 0.56% during the month of July. The Hypothetical Model Portfolio is up $5629.93 in 2006, a gain of 5.63%, as shown on the table below (click for a larger image of the table).

The portfolio was down substantially earlier in July before recovering strongly near the end of the month. This choppy performance is similar to what happened during June 2006. Tech stocks continued to struggle during July, resulting in a drop of 4.24% in the Nasdaq 100 ETF (QQQQ). The second biggest losss (on a percentage basis) was the Vanguard Small Cap Index (NAESX) which dropped 3.31% during July. The other big losers were the Vanguard Midcap Index (VIMSX) which fell 2.28% and the Templeton Russia closed-end fund (TRF) which dropped 2.24%.

On a positive note, large caps and dividend paying stocks performed well in July. The iShares Dow Jones U.S. Select Dividend Index Fund (DVY) and the S&P 500 Financial components ETF (XLF) returned 3.31% and 3.06%, respectively. Other top performers include the Emerging Markets ETF (EEM) and the Vanguard Developed Markets Index (VDMIX), which returned 2.34% and 1.16%, respectively.

Two of the holdings in my Hypothetical Model Portfolio paid dividends in July. As I mentioned in a previous post, the dividends from mutual fund holdings are reinvested, but the dividends from ETFs or the closed end fund (i.e., the Templeton Russia closed-end fund (TRF)) are not reinvested- they will accumulate as "CASH" on the performance table below.

XLF paid a dividend of $0.187 on July 31 (a total of $14.77) which was moved to "CASH" on the table shown below. QQQQ paid a dividend of $0.0257/share on July 31 (a total of $3.96) that was also moved to "CASH" on the table below. Accordingly, the value of accumulated and uninvested distributions is now up to $463.66.

The Hypothetical Model Portfolio's performance was not bad during July. The main thing holding it back was the poor return of tech stocks which dragged down QQQQ. Tech stocks have been out of favor with investors for 6+ years after so many got burned holding them when the bubble burst in 2000. Eventually investors will warm to tech again. I don't know when that will happen, but rest assured that it will eventually happen. That is why I included QQQQ in my Hypothetical Model Portfolio. I still firmly believe that this portfolio will outperform the major stock market averages over time.

*The Hypothetical Model Portfolio was hypothetically created with an investment of $100,000 with investments made as of the closing values on December 30, 2005. The reason why the total cost in the chart is greater than $100,000 is because the total cost accounts for the value of dividends reinvested into the mutual funds in the portfolio.