Wednesday, July 19, 2006
Emigrant Direct Is Raising Its Money Market Interest Rate to 5.15% On July 28
Today I received a letter from Emigrant Direct which contains a secure 10 digit access code for a new Emigrantdirect.com website. The letter also indicates that Emigrant Direct is raising its money market interest rate to 5.15% on July 28, 2006. The new rate will be 0.80% higher than the relatively platry 4.35% currently offered by INGDirect.
Friday, July 14, 2006
Attacks on Dollar-Cost Averaging Investment Strategies Are Unjustified
I’ve recently read a number of articles badmouthing a dollar-cost averaging investment strategy (i.e., investing a certain amount of money in stocks at regular intervals). Consider, for example, this article in USA Today.
The author mentions that if one had invested $100 per month in the Vanguard 500 Index Fund over the past decade, one would currently own shares worth $15,437, a gain of $3,437, or 31.3%, over the total invested amount of $12,000. The author contrasts this with an investment of $12,000 made exactly 10 years ago which would be worth about $26,640, a gain of 122%. The author claims that the disparity between the investor’s actual return of 31.3% and the total 122% return of the S&P 500 over the past 10 years shows that dollar-cost averaging doesn’t always work.
I wholeheartedly disagree with the author’s conclusion. First, the hypothetical investor discussed in the market desires to invest money periodically in the market and probably would not have the entire $12,000 to invest all at one time 10 years ago.
Second, because the dollar-cost averaged shares are purchased over a period of 10 years, the average share of stock would have been purchased only 5 years ago (halfway through the time period), so it’s not really fair to compare that with money invested a full 10 years ago. If the author wanted to make a fair comparison, he would compare the dollar-cost averaged shares purchased versus a lump-sum purchase make exactly 5 years ago, so that both investments have the same average investment time period. Seeing as how the stocks experienced a strong decline in 2001 and 2002, I would bet that the dollar-cost averaged shares would come out ahead in that comparison (with less risk!).
Third, one of the great benefits of dollar-cost averaging is that it spreads risk out over time. That is, instead of trying to guess where the “bottom” of the market is and invest all of one’s money at that time, the risk of over-paying for the stock can be spread out over an extended period of time. Several theories of equity valuation acknowledge that short-term inefficiencies exist in the market and that stocks often trade at a premium (or discount) to their true intrinsic value. However, there are few investors, if any, who have the ability to accurately determine the true intrinsic value of stocks at a particular time. By spreading the money to be invested in stocks over a long time period, the investor reduces his chances of overpaying, on average, for the stocks.
Fourth, by dollar-cost averaging with index funds the investor can avoid having to spend a lot of time/money researching stocks to determine which to purchase. Instead, the investor can simply determine the long-term historical returns/trends for stocks and invest accordingly. For example, I invest according to my Hypothetical Model Portfolio and expect it perform well over time.
Friday, July 07, 2006
June Returns For My Model Long-Term Portfolio
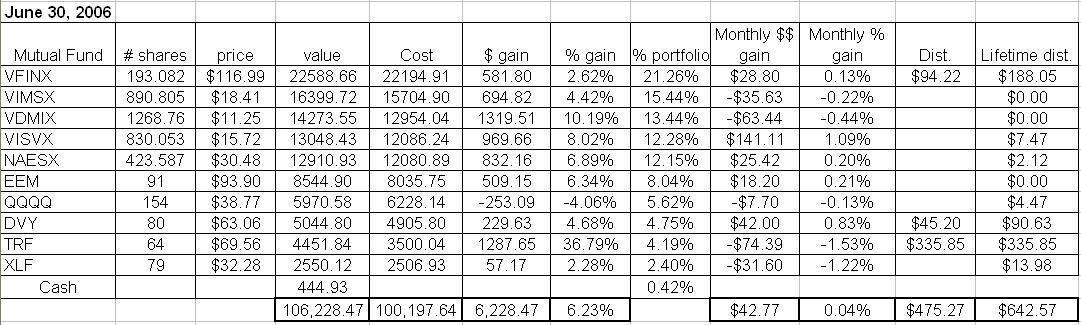
The performance of my Hypothetical Model Portfolio was flat during June. As of the market close on June 30, 2006, the Hypothetical Model Portfolio* increased in value by $42.77, or about 0.04% during June. The Hypothetical Model Portfolio is up $6228.47in 2006, a gain of 6.23%, as shown on the table below (click for a larger image of the table).
The portfolio was down substantially (bottoming near a loss of about $6,000) through most of the first half of June before recovering strongly near the end of the month to finish flat.
The Templeton Russia closed-end fund (TRF) continued to struggle, finishing with a loss of 1.53% for the month after being down about 30% for the month as of June 13th. The second-worst performer was the SPDR Financial components (XLF) which fell 1.22%.
On a positive note, my small cap holdings performed well. The Vanguard Small Cap Value Index (VISVX) was my top performer, returning 1.09% in June. The Vanguard Small Cap Index mutual fund (NAESX) was also positive, returning 0.20%. The Emerging Markets ETF (EEM) was another positive performer, recovering from a disastrous May by returning a respectable a respectable 0.21% in June. The iShares Dow Jones U.S. Select Dividend Index Fund (DVY) also performed well, returning 0.83% during June.
Four of the holdings in my Hypothetical Model Portfolio paid dividends in June. As I mentioned in a previous post, the dividends from mutual fund holdings are reinvested, but the dividends from ETFs or the closed end fund (i.e., the Templeton Russia closed-end fund (TRF)) are not reinvested- they will accumulate as "CASH" on the performance table below. The reason I am doing this is because the index mutual funds in this portfolio do not charge a transaction fee for reinvesting dividends. To reinvent dividends for any of the ETFs or TRF, on the other hand, would cause me to incur transaction fees for the trading commissions.
The Vanguard S&P 500 index fund (VFINX) paid a dividend of $0.49/share (a total of $94.22) which was reinvested on June 23 to purchase an additional 0.805 shares at a price of $116.99/share. DVY paid a dividend of $0.56501 on June 28 (a total of $45.20) which was moved to "CASH" on the table shown below. TRF paid a long-term distribution of $5.2476/share on June 19 (a total of $335.85) that was also moved to "CASH" on the table below.
The economy continues to hum along despite the FED interest rate increases. I suspect that the FED will raise rates a couple more times and then be done with it. Hopefully the market will finally surge at that time.
*The Hypothetical Model Portfolio was hypothetically created with an investment of $100,000 with investments made as of the closing values on December 30, 2005. The reason why the total cost in the chart is greater than $100,000 is because the total cost accounts for the value of dividends reinvested into the mutual funds in the portfolio.
Subscribe to:
Posts (Atom)