This chart was originally posted on the website for Callan Associates.
Showing posts with label Callan periodic table. Show all posts
Thursday, January 22, 2009
Updated "Periodic Table" of Equity Style Investment Returns Through 2008
An updated version of the Callan "Periodic Table" of equity style investment returns from 1989-2008 is posted below. (Click on the image below to see a larger version of the Periodic Table.) This Periodic Table illustrates calendar year returns for several indices, including the S&P 500, S&P/Citigroup 500 Growth, S&P 500/Citigroup 500 Value, Russell 2000, Russell 2000 Value, Russell 2000 Growth, MSCI EAFE, BC Agg bond, and NAREIT Equity REIT.
This chart was originally posted on the website for Callan Associates.
Wednesday, January 30, 2008
Updated "Periodic Table" of Equity Style Investment Returns Through 2007
Posted below is an updated version of the "Periodic Table" of equity style investment returns from 1988-2007. (Click on the image below to see a larger version of the Periodic Table.) This chart was originally posted on the website for Callan Associates.
*If the image is too difficult to see, you can view a .pdf of the image here.
I have written a new post with results from 1989-2008.
Friday, January 12, 2007
Updated "Periodic Table" of Equity Style Investment Returns Through 2006
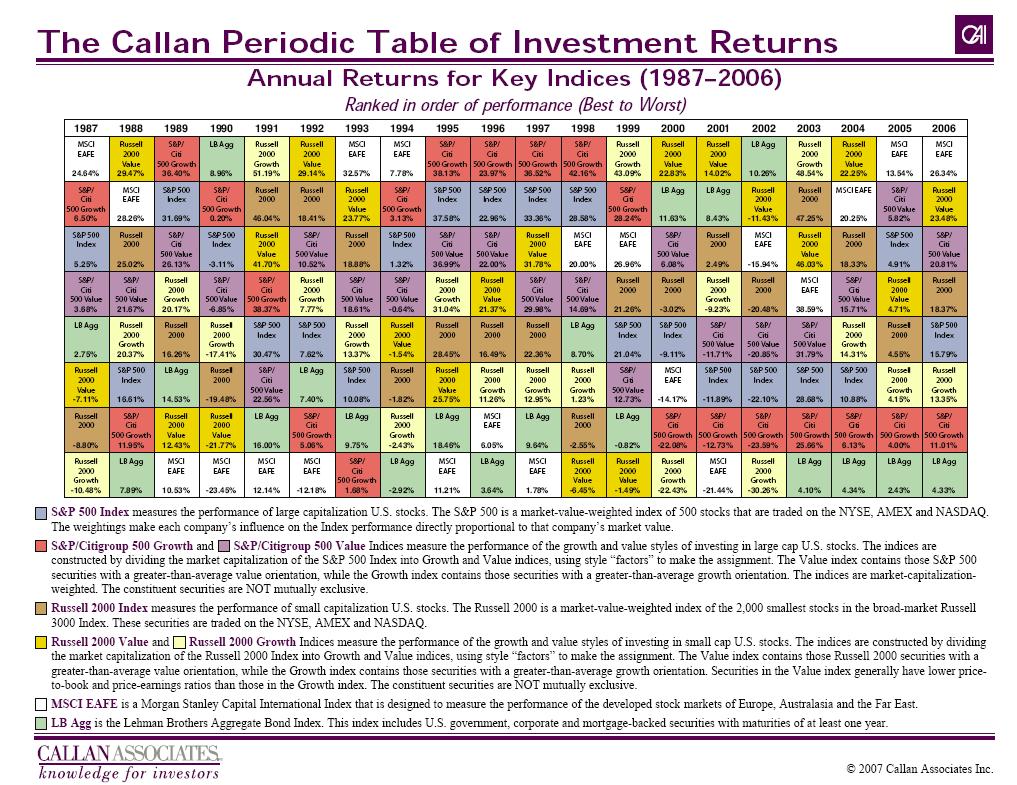
Posted below is an updated version of the "Periodic Table" of equity style investment returns from 1987-2006. (Click on the image below to see a larger version of the Periodic Table.) This chart was originally posted on the website for Callan Associates.

*If the image is fuzzy, you can see a .pdf of the image here.
I have written a new post with results from 1989-2008.

*If the image is fuzzy, you can see a .pdf of the image here.
I have written a new post with results from 1989-2008.
Tuesday, February 07, 2006
Updated "Periodic Table" of Equity Style Investment Returns Through 2005
Posted below is an updated version of the "Periodic Table" of equity style investment returns from 1986-2005. (Click on the image below to see a larger version of the Periodic Table.) This chart was originally posted on the website for Callan Associates.

*** I have written a new post with results from 1989-2008.

*** I have written a new post with results from 1989-2008.
Tuesday, December 20, 2005
"Periodic Table" of equity style investment returns from 1985-2004
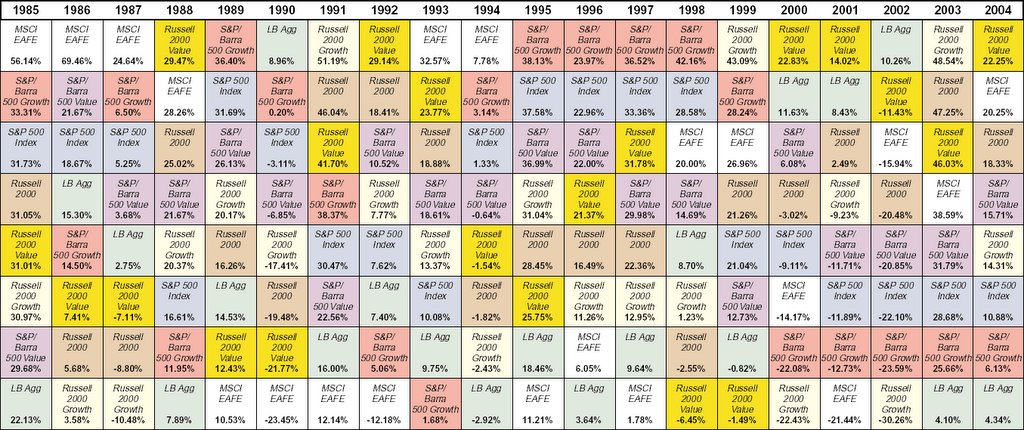
I recently found a "Periodic Table" of equity style investment returns from 1985-2004. The Periodic Table lists the annual returns for various types and styles of equity investments during the 1985-2004 time frame, as shown below. Specifically, annual returns are included for the following types and styles of equity investments: (a) S&P 500; (b) S&P/Barra 500 Growth; (c) S&P/Barra 500 Value; (d) Russell 2000; (e) Russell 2000 Value; (f) Russell 2000 Growth; (g) MSCI EAFE; and (h) the Lehman Brothers Aggegrate Bond index. (Click on the image below to see a larger version of the Periodic Table.)

*** I have written a new post with results from 1989-2008.

*** I have written a new post with results from 1989-2008.
Subscribe to:
Posts (Atom)