Sunday, April 30, 2006

April Returns For My Model Long-Term Portfolio

My Hypothetical Model Portfolio had another solid month in April. As of the market close on April 28, 2006, the Hypothetical Model Portfolio* was up $2,749.72, or 2.52% during March. The Hypothetical Model Portfolio is now up $11680 in 2006, a gain of 11.68%, as shown on the table below (click for a larger image of the table).

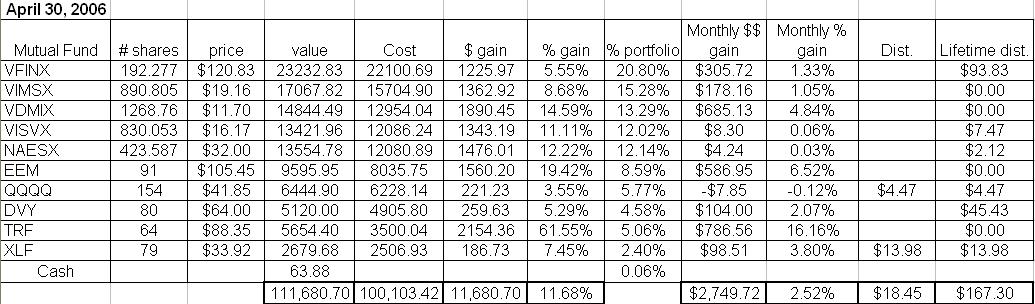
Foreign holdings were my top performers in April, with the Templeton Russia closed-end fund (TRF) leading the way with a strong 16.16% return. The Emerging Markets ETF (EEM) was the second-best performer with a 6.52% return, and the Vanguard Developed Markets index fund (VDMIX) came in third place with a return of 4.84%. Through the first four months of 2006, TRF is already up a whopping 61.55%, EEM is up 19.42%, and VDMIX is up 14.59%! I expect foreign equities to continue to perform well given that the U.S. Dollar is bound to fall relative to foreign currencies due to the United States’ massive trade deficit. Also, TRF and EEM are invested heavily in countries that are huge net exporters of oil and raw materials and will continue to benefit from the current commodities boom.

Other solid April performers include the SPDR Financial components (XLF) which returned 3.80% and the iShares Dow Jones U.S. Select Dividend Index ETF fund which returned 2.07%. Both of these invest heavily in financial stocks. These probably did well in April after the FED indicated it is close to halting its interest rate hikes.

Vanguard Index 500 mutual fund (VFINX) and the Vanguard Midcap Index mutual fund (VIMSX) were up just over 1% in April, and the small cap holdings (i.e., Vanguard Small Cap Index mutual fund (NAESX) and Vanguard Small Cap Value Index (VISVX)) were barely changed in April. The only holding that fell in value was the Nasdaq 100 ETF (QQQQ), which fell about .12%.

Two of the holdings in my Hypothetical Model Portfolio paid dividends in March. As I mentioned in a previous post, the dividends from mutual fund holdings are reinvested, but the dividends from ETFs or a closed end fund (i.e., TRF) are not reinvested- they will accumulate as "CASH" on the performance table below. The reason I am doing this is because the index mutual funds in this portfolio do not charge a transaction fee for reinvesting dividends. To reinvent dividends for any of the ETFs or TRF, on the other hand, would cause me to incur transaction fees for the trading commissions.

XLF paid a dividend of $0.177 on April 28 (a total of $13.98), and QQQQ paid a dividend of $0.029 on April 28 (a total of $4.47), both of which were moved to "CASH" on the table shown below.

*The Hypothetical Model Portfolio was hypothetically created with an investment of $100,000 with investments made as of the closing values on December 30, 2005. The reason why the total cost in the chart is greater than $100,000 is because the total cost accounts for the value of dividends reinvested into the mutual funds in the portfolio.

Friday, April 28, 2006

The iShares Silver ETF Was Launched Today

The first silver-based ETF was launched today by Barclays Global Investors. The name of the ETF is the iShares Silver Trust and its ticker symbol is SLV. Each share of SLV will initially represent 10 ounces of silver and opened at $129/share on the AMEX today. For almost all investors, SLV provides the cheapest means of buying and selling silver.

TheStreet.Com article about SLV

Thursday, April 27, 2006

Some ETFs Are Very Difficult To Sell Short Due To A Shortage Of Available Shares

Smartmoney.com has an interesting article about shorting ETFs. The focus of the article is that despite the ETF industry's claims that one of the major benefits of ETFs is their ability to be sold short, many brokers are unable to actually sell shares of some of the ETFs short due to a shortage of available shares.

As I mentioned in a previous post, to sell shares short, one's broker has to borrow the shares from some other party who has a long position on the shares (usually another broker). Unfortunately, if no shares are available for borrowing, then it is not be possible to sell short any shares. This is disconcerting because on of the strategies I intend to implement in the future is a long-short arbitrage strategy (I have already tested such a strategy, as discussed here and here) where I sell short shares of a first ETF and use the proceeds of the short sale to purchase a long posiiton of a second, and different, ETF I think will outperform the first ETF.

Monday, April 24, 2006

Stock Market Styles Are Very Cyclical

NYC Money has a good article posted on her blog regarding large caps and why the financial industry keeps promoting them. She postulates that the financial industry including writers for financial media really have no idea how to make money in the stock market and so they thereofre just keep repeating the same "advice" everyone else has been giving.

I agree with what she wrote and some of the comments posted there. If money managers and financial writers really wanted investors to achieve the highest returns over the long haul, they would tell them to invest in value and small caps, placing a large amount in small cap value stocks. If one had invested $10,000 in small cap value stocks in 1926 and held them and re-invested the dividends, that investment would have been worth about $1 billion by the end of 2004, as discussed in a previous post I wrote about small-cap outperformance.

She mentioned she doing well in foreign equities and I admit that I myself have been investing in foreign stocks over the past year and have done well. However, if there's one thing I've learned by following the markets and investing for the last 10+ years it is that the stock market tends to be very cyclical. Investing styles tend to do in and out of favor. For most of the 90s, large caps (especially large cap growth) performed very well and may have provided better returns than small caps or foreign stocks. Small caps and mid caps have substantially outperformed large caps since 2000. The tide will eventually turn again, although I don't really know when that will be.

Foreign stocks and emerging markets performed very poorly in the late 80s and during most of the 90s. The problem with a lot of the emerging markets is that the political situations in those countries are frequently unstable. Investors in emerging markets took a bath, for example, (a) in the mid-90s when Mexico's currency collapsed, (b) in the late 90s when the Asian currency crises occurred and Russia devalued its currency, and (c) in or around 2001 when Argentina defaulted on billions of dollars in international loans and its currency collapsed.

The stock markets of foreign developed markets (e.g., in high GDP countries such as Japan or Western Europe) also tended to trail the large cap US stocks in the 90s due to the Japanese stock market crash, although they have certainly provided better returns than U.S. large caps over the past 6 years.

I think that a well-diversified portfolio, such as my Hypothetical Long-Term Portfolio, should include large caps, mid caps, small caps, and foreign developed and emerging markets stocks. In a previous post I posted a useful chart that illustrates the annual returns for various investment styles between 1986 and 2005.

Thursday, April 20, 2006

The Silver Market Is In A Free-Fall Today

I just checked the price of silver and was shocked to see that it fell over 14% today, from $14.53 per ounce all the way down to $12.41 per ounce. Presumably, speculators are locking in gains from silver's YTD 63% gain as of yesterday. I don't know what will happen to silver in the short-term, but it would not surprise me to see its ascent continue later in 2006. The silver market kind of reminds me of the Nasdaq in the late 90s when the Nasdaq Composite Index experienced tremendous volatility and shot up in value to levels that could not be justified by the underlying fundamentals.

Thursday, April 13, 2006

Website For Performing Historical U.S. Dollar Value Comparisons

I have discovered a great website entitled "Economic History Services" that allows one to see just how much the value of the U.S. dollar has eroded over time. You can input a dollar value between 1790 and 2004 and out how much it was worth in a different year. Several methods are used to determine the relative valuation, including CPI, GDP deflator, Unskilled wage, GDP per capital, and (relative share of) GDP.

Monday, April 10, 2006

Great Artilce About the Lagging Performance of Large Cap Stocks in This Week's Issue of BusinessWeek

BusinessWeek has a great article entitled "Blue Chip Blues" about the lagging performance of large cap stocks relative to their small cap and international peers. The author discussed why large cap stocks have performed so poorly this decade and why their underperformance might continue on into the future.

I found this article to be interesting. I personally have a very difficult time believing that large cap stocks are no longer worthy of my investment dollars. Investing styles tend to be very cyclical. Large cap stocks are not currently viewed as favorably as small cap or mid-cap stocks. However, during the mid-late 90s the exact opposite was true. I believe that the tide will eventually turn and large caps will start to outperform again. Over the long, long run (e.g., a 20-30 time frame), I believe small cap stocks will outperform. However, over a 5- or 10-year time frame, I do believe that it is possible for large cap stocks to generate better returns than small caps. I guess we'll all have to wait and see what happens.

Thursday, April 06, 2006

Since Commodities Are Soaring, I am Saving Nickels and Pre-1982 Pennies

The price of copper has continued to soar. As of the commodity market close today, one pound of copper was trading for $2.6112. The price of nickel and zinc has also been soaring - as of today's market close, one pound of zinc was trading for $1.2909 and one pound of nickel was trading for $7.7564.

As I mentioned in a previous post, I have been saving my pre-1982 pennies for several months now because pre-1982 pennies contained 95% copper and copper has risen so much in value. A pre-1982 penny now contains about 1.745 cents worth of copper in it. That is, the copper in a pre-1982 penny is worth 74.5% more than the face value of a penny.

Nickels also contain a large percentage of copper. Almost all nickels made between 1938 and 2006 contain 75% copper and 25% nickel (the exception was during 1942-1945 when almost all nickels contained silver and manganese instead of nickel). The current commodity value of the metals in a nickel is about 4.24936 cents, or 84.98% of the 5-cent face value of a nickel. Given how well commodities have been performing, it seems likely that the prices of copper and nickel will continue to rise to the point at which the metal in the nickel are worth more than the face value of the nickel. I have therefore been hording the nickels I get in change. Also, because the design on all nickels made from 2006 on into the future is different than the design on older nickels, I believe that nickels from 2005 and earlier will also eventually have a numismatic value exceeding five cents, regardless of the metal value contained within them.

Here is an image captured from coinflation.com showing the current intrinsic values of various coins in circulation based on the value of the metals contained within those coins:

Wednesday, April 05, 2006

March Returns For My Model Long-Term Portfolio

My Hypothetical Model Portfolio performed very well in March. As of the market close on March 31, 2006, the Hypothetical Model Portfolio was up $2,718.39, or 2.56% during March. The Hypothetical Model Portfolio is now up $8930 in 2006, a gain of 8.93%, as shown on the table below (click for a larger image of the table).

Small caps were my best performers, with the Vanguard Small Cap index fund (NAESX) leading the gains with a rise of 4.18%, and the Vanguard Small Cap Value index fund (VISVX) rising 3.58%. My diversified international index fund, the Vanguard Developed Markets index fund (VDMIX) also performed well, rising 3.53%.

However, March was not a particularly great month for the holdings paying substantial dividends. As shown in the table below, iShares Dow Jones U.S. Select Dividend Index Fund (DVY) lost 0.11% in March, and the SPDR financial component index ETF gained only 0.74%. Financials are a major component of DVY, so perhaps the relatively flat yield curve is an explanation as to why the financial stocks performed so poorly in March.

Four of the holdings in my Hypothetical Model Portfolio paid dividends in March. As I mentioned in a previous post, the dividends from mutual fund holdings are reinvested, but the dividends from ETFs or a closed end fund (i.e., the Templeton Russia closed-end fund (TRF)) are not reinvested- they will accumulate as "CASH" on the performance table below. The reason I am doing this is because the index mutual funds in this portfolio do not charge a transaction fee for reinvesting dividends. To reinvent dividends for any of the ETFs or TRF, on the other hand, would cause me to incur transaction fees for the trading commissions. Since the dividend on DVY was only $45.43, paying a $5 commission to purchase more shares would not make sense.

The Vanguard S&P 500 index fund (VFINX) paid a dividend of $0.49/share (a total of $93.83) which was reinvested on March 17 to purchase an additional 0.780 shares at a price of $120.35/share. VISVX paid a dividend of $0.009/share (a total of $7.47) which was reinvested on March 17 to purchase an additional 0.467 shares at a price of $15.98/share. NAESX paid a dividend of $0.005/share (a total of $2.12) which was reinvested on March 17 to purchase an additional 0.068 shares at a price of $31.40/share. DVY paid a dividend of $0.56787 on March 20 (a total of $45.43) which was moved to "CASH" on the table shown below.

Sunday, April 02, 2006

The Nasdaq 100 ETF (QQQQ) Is Paying A Quarterly Dividend On April 28, 2006

The Nasdaq 100 ETF (symbol: QQQQ) is paying a dividend of $0.0291 per share on April 28, 2006. This dividend is being paid to shareholders of record as of March 21, 2006.

It took me awhile to find the actual distribution date of this dividend. Yahoo Finance had indicated that the dividend was declared on Marh 17, 2006, but it did not list when the payout date would be. I was finally able to determine the payout date after some searching on google and finding this article.