LSI Logic (symbol: LSI), an integrated circuit and data storage chip designer, is the only individual stock I own in my non-IRA portfolio. LSI, like all semiconductor stocks, is extremely volatile and has stretches of time where it has risen or fallen by 30% in a 2-3 month time span.
I accumulated my LSI position over a period of 2 years, buying shares periodically on dips between October 2002 and July 2004. My average cost basis is $6/share and I have been waiting for LSI to break above $12 so that I can sell my shares and realize a 100+% gain.
LSI closed at $8 on the last trading day in December 2005. It rose to $11.81 on March 31st, but has floundered since then, dropping down below $8, with its lowest close occurring on August 25th, when it closed at $7.46/share.
LSI reported its earnings for its 3rd fiscal quarter yesterday. I expected them to be lackluster, but I was pleasantly surprised. The Street was expecting earnings of 12 cents per share, and LSI reported non-GAAP earnings of 16 cents per share. LSI also provided decent guidance for the upcoming quarter. Wall Street took notice and has bid LSI higher by about 16% today, up to $9.69/share.
Thursday, October 26, 2006


Wednesday, October 25, 2006
Add My Financeandinvestments Blog to My Yahoo!
I was recently playing around on My Yahoo! and I discovered a way to link content from my blog to my My Yahoo! page so that recent posts are listed along with the standard categorized news. I am no HTML expert, but I think that this was relatively simple to do.
If you want to add Financeandinvestments.blogspot.com to your My Yahoo! page so that you can see my most recent posts about stocks and personal finance, all you need to do is click on the "Add Content" link at the bottom of your My Yahoo! page. On the next page you will need to click on the link entitled "Add RSS by URL" to the right of the displayed "Find Content" box. On the subsequent page, type this URL into the box:
http://financeandinvestments.blogspot.com/rss.xml
Finally, you can click on the link to return to My Yahoo! Once back on the My Yahoo! page, I clicked the "edit" button on the tab for my my blog. I personalized the tab so that the 3 most recent posts are always linked to my My Yahoo! page, regardless of when those posts were created.
If you want to add Financeandinvestments.blogspot.com to your My Yahoo! page so that you can see my most recent posts about stocks and personal finance, all you need to do is click on the "Add Content" link at the bottom of your My Yahoo! page. On the next page you will need to click on the link entitled "Add RSS by URL" to the right of the displayed "Find Content" box. On the subsequent page, type this URL into the box:
http://financeandinvestments.blogspot.com/rss.xml
Finally, you can click on the link to return to My Yahoo! Once back on the My Yahoo! page, I clicked the "edit" button on the tab for my my blog. I personalized the tab so that the 3 most recent posts are always linked to my My Yahoo! page, regardless of when those posts were created.
Tuesday, October 24, 2006
I'm Still Saving U.S. Nickel Coins
Back on April 6, 2006 I wrote that I was saving all of the U.S. nickels I acquire in change because the melt value of nickels was about 4.24936 cents, or 84.98% of the 5-cent face value ofthe U.S. nickel coin. Almost all U.S. nickel coins made between 1938 and 2006 contain 75% copper and 25% nickel (the exception was during 1942-1945 when almost all nickels contained silver and manganese instead of nickel). At the time of my previous post, nickel was trading at $7.7564 per pound and copper was trading at $2.6112 per pound.
It's a good thing that I've been saving nickels because the value of nickel and copper has soared since April. One pound of nickel is now worth $15.4909, nearly twice what it was a mere 6 months ago. Copper has risen a slightly less impressive 31%, with one pound of copper now trading for $3.4302 per pound. The melt value of U.S. nickel coins is now about 7.10471 cents, or 142.09% of its 5 cent face value. The melt value of U.S. nickel coins has therefore risen about 67% since April.
If the value of copper and nickel remains strong, it's only a matter of time until everyone starts hoarding U.S. nickel coins, just like the U.S. population did in the 1960 when quarters used to be made of silver and the price of silver rose so much that the value of the silver in quarters exceeded the 25-cent face value of the quarters. Accordingly, I continue to recommend that people saved their nickels.
FYI, numismatic news has a great article about hording coins.
It's a good thing that I've been saving nickels because the value of nickel and copper has soared since April. One pound of nickel is now worth $15.4909, nearly twice what it was a mere 6 months ago. Copper has risen a slightly less impressive 31%, with one pound of copper now trading for $3.4302 per pound. The melt value of U.S. nickel coins is now about 7.10471 cents, or 142.09% of its 5 cent face value. The melt value of U.S. nickel coins has therefore risen about 67% since April.
If the value of copper and nickel remains strong, it's only a matter of time until everyone starts hoarding U.S. nickel coins, just like the U.S. population did in the 1960 when quarters used to be made of silver and the price of silver rose so much that the value of the silver in quarters exceeded the 25-cent face value of the quarters. Accordingly, I continue to recommend that people saved their nickels.
FYI, numismatic news has a great article about hording coins.
Friday, October 13, 2006
Interesting Website With Information About Dow Jones Indices
I have discovered a Dow Jones Index website that contains data for various Dow Jones indices. I especially enjoy looking at the current fundamental data for the Dow Jones 30 index. The website also lists miscellaneous trivia such as the best and worst one-day changes in the Dow Jones Industrial Average, the best and worst one-year returns, and the dates upon which certain milestones occurred (such as the day the Dow Jones Industrial Average closed above 10,000 for the first time).
Monday, October 02, 2006
September 2006 Returns For My Model Long-Term Portfolio
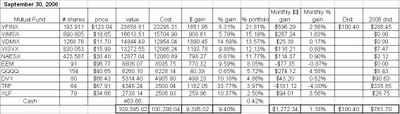
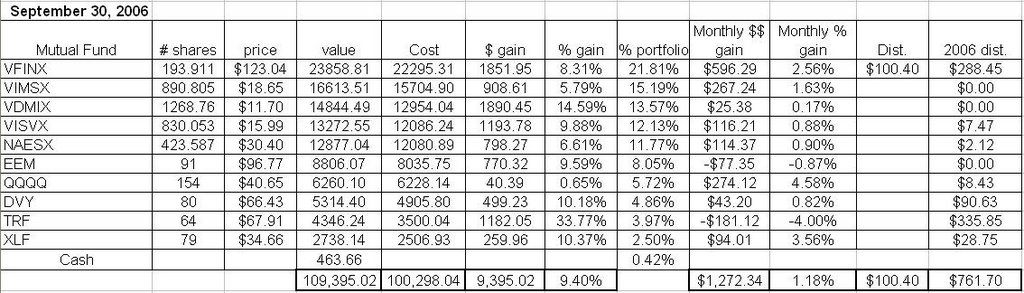
My Hypothetical Model Portfolio had decent returns during the month of September. As of the market close on September 29, 2006, the Hypothetical Model Portfolio* increased in value by $1272.34, or about 1.18% during the month of September. The Hypothetical Model Portfolio is now up $9395.02 in 2006, a gain of 9.40%, as shown on the table below (click for a larger image of the table).
The portfolio was strong throughout the month. Tech stocks led the way for the second straight moneth, with the Nasdaq 100 ETF (QQQQ) rising 4.58%. The second biggest winner (on a percentage basis) was the S&P 500 Financial components ETF (XLF), which appreciated by 3.56%. Large cap stocks also performed very well - the Vanguard S&P 500 Index fund (VFINX) rose about 2.56%.
Small caps and international stocks were laggards during September, possibly due to a stronger U.S. dollar. The Templeton Russia closed-end fund (TRF) and
the iShares Emerging Markets ETF (EEM) both posted negative returns, falling about 4.00% and 0.87%, respectively. Other dogs include the Vanguard Developed Markets Index fund (VDMIX), the Vanguard Small Cap Value Index (VISVX), and the Vanguard Small Cap Index (NAESX) which rose just 0.17%, 0.88%, and 0.90%, respectively.
One of the holdings in my Hypothetical Model Portfolio, VFINX, paid dividends during Septmember. As I mentioned in a previous post, the dividends from mutual fund holdings are reinvested, but the dividends from ETFs or the closed end fund (i.e., the Templeton Russia closed-end fund (TRF)) are not reinvested- they will accumulate as "CASH" on the performance table below. VFINX paid a dividend of $0.52/share (a total of $100.40) which was reinvested on September 22 to purchase an additional 0.829 shares at a price of $121.08/share.
I was glad to see decent returns in August. Hopefully stocks will perform well during the 4th quarter of 2006 so that my Hypothetical Model Portfolio will end 2006 up 10-15%.
*The Hypothetical Model Portfolio was hypothetically created with an investment of $100,000 with investments made as of the closing values on December 30, 2005. The reason why the total cost in the chart is greater than $100,000 is because the total cost accounts for the value of dividends reinvested into the mutual funds in the portfolio.
The portfolio was strong throughout the month. Tech stocks led the way for the second straight moneth, with the Nasdaq 100 ETF (QQQQ) rising 4.58%. The second biggest winner (on a percentage basis) was the S&P 500 Financial components ETF (XLF), which appreciated by 3.56%. Large cap stocks also performed very well - the Vanguard S&P 500 Index fund (VFINX) rose about 2.56%.
Small caps and international stocks were laggards during September, possibly due to a stronger U.S. dollar. The Templeton Russia closed-end fund (TRF) and
the iShares Emerging Markets ETF (EEM) both posted negative returns, falling about 4.00% and 0.87%, respectively. Other dogs include the Vanguard Developed Markets Index fund (VDMIX), the Vanguard Small Cap Value Index (VISVX), and the Vanguard Small Cap Index (NAESX) which rose just 0.17%, 0.88%, and 0.90%, respectively.
One of the holdings in my Hypothetical Model Portfolio, VFINX, paid dividends during Septmember. As I mentioned in a previous post, the dividends from mutual fund holdings are reinvested, but the dividends from ETFs or the closed end fund (i.e., the Templeton Russia closed-end fund (TRF)) are not reinvested- they will accumulate as "CASH" on the performance table below. VFINX paid a dividend of $0.52/share (a total of $100.40) which was reinvested on September 22 to purchase an additional 0.829 shares at a price of $121.08/share.
I was glad to see decent returns in August. Hopefully stocks will perform well during the 4th quarter of 2006 so that my Hypothetical Model Portfolio will end 2006 up 10-15%.
*The Hypothetical Model Portfolio was hypothetically created with an investment of $100,000 with investments made as of the closing values on December 30, 2005. The reason why the total cost in the chart is greater than $100,000 is because the total cost accounts for the value of dividends reinvested into the mutual funds in the portfolio.
Friday, September 22, 2006
The SPDR Financial components (XLF) Is Paying A Quarterly Dividend On October 31, 2006
The SPDR Financial components (symbol: XLF) is paying a quarterly dividend of $0.1938 per share on October 31, 2006. It is often difficult to find much information about upcoming dividends for XLF. However, I was able to discover the relevant information by viewing the ETF information available at Amex.com.
Monday, September 18, 2006
August 2006 Returns For My Model Long-Term Portfolio
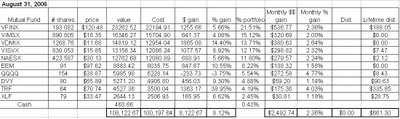
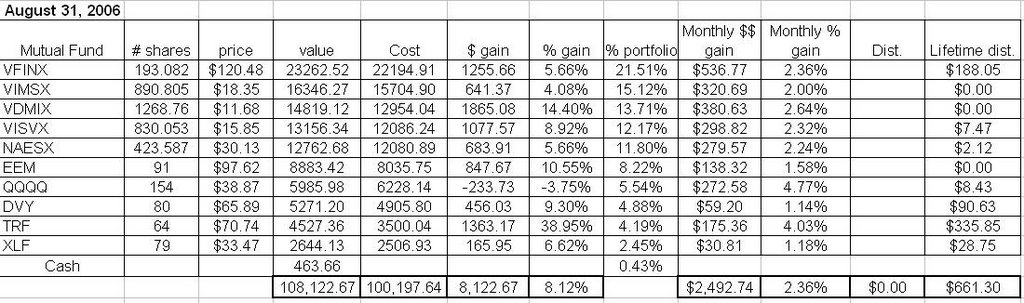
My Hypothetical Model Portfolio experienced its strongest month since April. As of the market close on August 31, 2006, the Hypothetical Model Portfolio* increased in value by $2492.74, or about 2.36% during the month of August. The Hypothetical Model Portfolio is now up $8122.67 in 2006, a gain of 8.12%, as shown on the table below (click for a larger image of the table).
The portfolio rallied toward the end of the month to show the impressive August returns. Tech stocks led the way, with the Nasdaq 100 ETF (QQQQ) rising 4.77%. The second biggest winner (on a percentage basis) was the Templeton Russia closed-end fund (TRF), which increased in value by about 4.03%, bringing its total return for 2006 through August 31st to an impressive 38.95%. Other solid performers included the Vanguard Developed Markets Index fund (VDMIX) and the Vanguard S&P 500 Index fund (VFINX), which returned about 2.64% and 2.36%, respectively, during August.
Dividend-paying stocks and the emerging markets were the laggards last month. The iShares Dow Jones U.S. Select Dividend Index Fund (DVY), the S&P 500 Financial components ETF (XLF), and the iShares Emerging Markets ETF (EEM) had sub-par returns of about 1.14%, 1.18%, and 1.58%, respectively. I suppose this was to be expected, as these three ETFs were the top performers in July.
I was glad to see QQQQ finally show some decent returns in August. It was bound to happen sooner or later. QQQQ is still down about 3.75% on the year, but I suspect we'll see tech stocks rally through the last quarter of 2006.
*The Hypothetical Model Portfolio was hypothetically created with an investment of $100,000 with investments made as of the closing values on December 30, 2005. The reason why the total cost in the chart is greater than $100,000 is because the total cost accounts for the value of dividends reinvested into the mutual funds in the portfolio.
The portfolio rallied toward the end of the month to show the impressive August returns. Tech stocks led the way, with the Nasdaq 100 ETF (QQQQ) rising 4.77%. The second biggest winner (on a percentage basis) was the Templeton Russia closed-end fund (TRF), which increased in value by about 4.03%, bringing its total return for 2006 through August 31st to an impressive 38.95%. Other solid performers included the Vanguard Developed Markets Index fund (VDMIX) and the Vanguard S&P 500 Index fund (VFINX), which returned about 2.64% and 2.36%, respectively, during August.
Dividend-paying stocks and the emerging markets were the laggards last month. The iShares Dow Jones U.S. Select Dividend Index Fund (DVY), the S&P 500 Financial components ETF (XLF), and the iShares Emerging Markets ETF (EEM) had sub-par returns of about 1.14%, 1.18%, and 1.58%, respectively. I suppose this was to be expected, as these three ETFs were the top performers in July.
I was glad to see QQQQ finally show some decent returns in August. It was bound to happen sooner or later. QQQQ is still down about 3.75% on the year, but I suspect we'll see tech stocks rally through the last quarter of 2006.
*The Hypothetical Model Portfolio was hypothetically created with an investment of $100,000 with investments made as of the closing values on December 30, 2005. The reason why the total cost in the chart is greater than $100,000 is because the total cost accounts for the value of dividends reinvested into the mutual funds in the portfolio.
Thursday, August 31, 2006
Historical Dividends for the S&P 500
Dividends are crucial to any long-term investor's portfolio. During extended bear markets they often provide the only positive returns to the investor. I have often wondered about the long-term historical dividend increases of various stock indices, such as the S&P 500 index, but have had difficulty finding information going back more than 20 years or so. Luckily, however, I discovered an article concerning historical dividend growth and stock valuations between 1871 and 2003. This article is entitled "Dividends and Stock Valuation: A Study From the Nineteenth to the Twenty-First Century".
This article provides various data which it purports to relate to dividends and valuations for the S&P 500 dating back to 1871.* As shown in the chart below, dividends increased an average of 3.23% per year between 1871 and 2003. However, this average increase was not uniform. The chart below divides the dividend increases into three periods: (a) 1871-1913, (b) 1914-1945, and (c) 1946-2003. Between 1871 and 1913, dividends increased an average of 1.51% annually, between 1914 and 1945 they increased about 1.00% annually, and between 1946 and 2003 they increased an average of 5.74% annually. The dividend increases have accelerated further since 2003, as discussed in a previous post.
The annual dividend increases since 1946 have been very impressive. This highlights the reason why I am a strong believer that dividend-paying stocks should comprise a portion of every investor's portfolio. In fact, I believe that dividend-paying stocks are far more attractive than bonds for young investors (e.g., investors under 35 or 40 who will likely participate in the workforce for 20+ more years) for several reasons.
First, dividend income is generally taxable at a maximum rate of 15% a year as opposed to bond payouts which are generally taxed as ordinary income (i.e., at a tax rate of up to 35% for an individual). Second, dividend-paying stocks offer a great potential for capital gains not provided by bonds. For example, in the event that the earnings for the companies paying dividends keep increasing, there is a likelihood that their associated stock prices will also rise and that their dividend payouts will increase accordingly. Bonds, on the other hand, pay the same interest payout amounts year-after-year.
Finally, dividend-paying stocks provide some protection against inflation that bonds necessarily cannot provide. The prevailing view holds that as inflation heats up companies raise prices and the revenue from the inflated prices is reflected as increased company earnings. As earnings increase, the corresponding stock prices and dividends generally increase accordingly, as discussed above. However, during such inflationary periods, bonds become less valuable. For example, a 5% payout may be attractive when inflation is running at 1% per year, but are far less attractive when inflation accelerates to 6% per year.
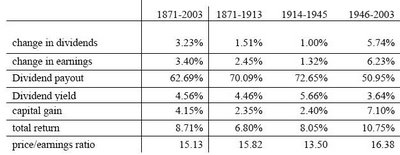
*This data cannot be correct, however, as the S&P 500 index was only created in or around 1923. I presume that the data prior to 1923 must have come from a similar index of large-cap stocks.
This article provides various data which it purports to relate to dividends and valuations for the S&P 500 dating back to 1871.* As shown in the chart below, dividends increased an average of 3.23% per year between 1871 and 2003. However, this average increase was not uniform. The chart below divides the dividend increases into three periods: (a) 1871-1913, (b) 1914-1945, and (c) 1946-2003. Between 1871 and 1913, dividends increased an average of 1.51% annually, between 1914 and 1945 they increased about 1.00% annually, and between 1946 and 2003 they increased an average of 5.74% annually. The dividend increases have accelerated further since 2003, as discussed in a previous post.
The annual dividend increases since 1946 have been very impressive. This highlights the reason why I am a strong believer that dividend-paying stocks should comprise a portion of every investor's portfolio. In fact, I believe that dividend-paying stocks are far more attractive than bonds for young investors (e.g., investors under 35 or 40 who will likely participate in the workforce for 20+ more years) for several reasons.
First, dividend income is generally taxable at a maximum rate of 15% a year as opposed to bond payouts which are generally taxed as ordinary income (i.e., at a tax rate of up to 35% for an individual). Second, dividend-paying stocks offer a great potential for capital gains not provided by bonds. For example, in the event that the earnings for the companies paying dividends keep increasing, there is a likelihood that their associated stock prices will also rise and that their dividend payouts will increase accordingly. Bonds, on the other hand, pay the same interest payout amounts year-after-year.
Finally, dividend-paying stocks provide some protection against inflation that bonds necessarily cannot provide. The prevailing view holds that as inflation heats up companies raise prices and the revenue from the inflated prices is reflected as increased company earnings. As earnings increase, the corresponding stock prices and dividends generally increase accordingly, as discussed above. However, during such inflationary periods, bonds become less valuable. For example, a 5% payout may be attractive when inflation is running at 1% per year, but are far less attractive when inflation accelerates to 6% per year.
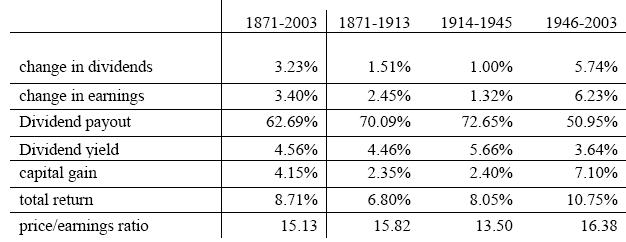
*This data cannot be correct, however, as the S&P 500 index was only created in or around 1923. I presume that the data prior to 1923 must have come from a similar index of large-cap stocks.
Thursday, August 03, 2006
July Returns For My Model Long-Term Portfolio
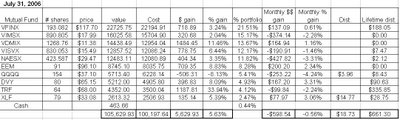
My Hypothetical Model Portfolio was slightly down during July. As of the market close on July 31, 2006, the Hypothetical Model Portfolio* decreased in value by $598.54, or about 0.56% during the month of July. The Hypothetical Model Portfolio is up $5629.93 in 2006, a gain of 5.63%, as shown on the table below (click for a larger image of the table).
The portfolio was down substantially earlier in July before recovering strongly near the end of the month. This choppy performance is similar to what happened during June 2006. Tech stocks continued to struggle during July, resulting in a drop of 4.24% in the Nasdaq 100 ETF (QQQQ). The second biggest losss (on a percentage basis) was the Vanguard Small Cap Index (NAESX) which dropped 3.31% during July. The other big losers were the Vanguard Midcap Index (VIMSX) which fell 2.28% and the Templeton Russia closed-end fund (TRF) which dropped 2.24%.
On a positive note, large caps and dividend paying stocks performed well in July. The iShares Dow Jones U.S. Select Dividend Index Fund (DVY) and the S&P 500 Financial components ETF (XLF) returned 3.31% and 3.06%, respectively. Other top performers include the Emerging Markets ETF (EEM) and the Vanguard Developed Markets Index (VDMIX), which returned 2.34% and 1.16%, respectively.
Two of the holdings in my Hypothetical Model Portfolio paid dividends in July. As I mentioned in a previous post, the dividends from mutual fund holdings are reinvested, but the dividends from ETFs or the closed end fund (i.e., the Templeton Russia closed-end fund (TRF)) are not reinvested- they will accumulate as "CASH" on the performance table below.
XLF paid a dividend of $0.187 on July 31 (a total of $14.77) which was moved to "CASH" on the table shown below. QQQQ paid a dividend of $0.0257/share on July 31 (a total of $3.96) that was also moved to "CASH" on the table below. Accordingly, the value of accumulated and uninvested distributions is now up to $463.66.
The Hypothetical Model Portfolio's performance was not bad during July. The main thing holding it back was the poor return of tech stocks which dragged down QQQQ. Tech stocks have been out of favor with investors for 6+ years after so many got burned holding them when the bubble burst in 2000. Eventually investors will warm to tech again. I don't know when that will happen, but rest assured that it will eventually happen. That is why I included QQQQ in my Hypothetical Model Portfolio. I still firmly believe that this portfolio will outperform the major stock market averages over time.
*The Hypothetical Model Portfolio was hypothetically created with an investment of $100,000 with investments made as of the closing values on December 30, 2005. The reason why the total cost in the chart is greater than $100,000 is because the total cost accounts for the value of dividends reinvested into the mutual funds in the portfolio.
The portfolio was down substantially earlier in July before recovering strongly near the end of the month. This choppy performance is similar to what happened during June 2006. Tech stocks continued to struggle during July, resulting in a drop of 4.24% in the Nasdaq 100 ETF (QQQQ). The second biggest losss (on a percentage basis) was the Vanguard Small Cap Index (NAESX) which dropped 3.31% during July. The other big losers were the Vanguard Midcap Index (VIMSX) which fell 2.28% and the Templeton Russia closed-end fund (TRF) which dropped 2.24%.
On a positive note, large caps and dividend paying stocks performed well in July. The iShares Dow Jones U.S. Select Dividend Index Fund (DVY) and the S&P 500 Financial components ETF (XLF) returned 3.31% and 3.06%, respectively. Other top performers include the Emerging Markets ETF (EEM) and the Vanguard Developed Markets Index (VDMIX), which returned 2.34% and 1.16%, respectively.
Two of the holdings in my Hypothetical Model Portfolio paid dividends in July. As I mentioned in a previous post, the dividends from mutual fund holdings are reinvested, but the dividends from ETFs or the closed end fund (i.e., the Templeton Russia closed-end fund (TRF)) are not reinvested- they will accumulate as "CASH" on the performance table below.
XLF paid a dividend of $0.187 on July 31 (a total of $14.77) which was moved to "CASH" on the table shown below. QQQQ paid a dividend of $0.0257/share on July 31 (a total of $3.96) that was also moved to "CASH" on the table below. Accordingly, the value of accumulated and uninvested distributions is now up to $463.66.
The Hypothetical Model Portfolio's performance was not bad during July. The main thing holding it back was the poor return of tech stocks which dragged down QQQQ. Tech stocks have been out of favor with investors for 6+ years after so many got burned holding them when the bubble burst in 2000. Eventually investors will warm to tech again. I don't know when that will happen, but rest assured that it will eventually happen. That is why I included QQQQ in my Hypothetical Model Portfolio. I still firmly believe that this portfolio will outperform the major stock market averages over time.
*The Hypothetical Model Portfolio was hypothetically created with an investment of $100,000 with investments made as of the closing values on December 30, 2005. The reason why the total cost in the chart is greater than $100,000 is because the total cost accounts for the value of dividends reinvested into the mutual funds in the portfolio.

Wednesday, July 19, 2006
Emigrant Direct Is Raising Its Money Market Interest Rate to 5.15% On July 28
Today I received a letter from Emigrant Direct which contains a secure 10 digit access code for a new Emigrantdirect.com website. The letter also indicates that Emigrant Direct is raising its money market interest rate to 5.15% on July 28, 2006. The new rate will be 0.80% higher than the relatively platry 4.35% currently offered by INGDirect.
Friday, July 14, 2006
Attacks on Dollar-Cost Averaging Investment Strategies Are Unjustified
I’ve recently read a number of articles badmouthing a dollar-cost averaging investment strategy (i.e., investing a certain amount of money in stocks at regular intervals). Consider, for example, this article in USA Today.
The author mentions that if one had invested $100 per month in the Vanguard 500 Index Fund over the past decade, one would currently own shares worth $15,437, a gain of $3,437, or 31.3%, over the total invested amount of $12,000. The author contrasts this with an investment of $12,000 made exactly 10 years ago which would be worth about $26,640, a gain of 122%. The author claims that the disparity between the investor’s actual return of 31.3% and the total 122% return of the S&P 500 over the past 10 years shows that dollar-cost averaging doesn’t always work.
I wholeheartedly disagree with the author’s conclusion. First, the hypothetical investor discussed in the market desires to invest money periodically in the market and probably would not have the entire $12,000 to invest all at one time 10 years ago.
Second, because the dollar-cost averaged shares are purchased over a period of 10 years, the average share of stock would have been purchased only 5 years ago (halfway through the time period), so it’s not really fair to compare that with money invested a full 10 years ago. If the author wanted to make a fair comparison, he would compare the dollar-cost averaged shares purchased versus a lump-sum purchase make exactly 5 years ago, so that both investments have the same average investment time period. Seeing as how the stocks experienced a strong decline in 2001 and 2002, I would bet that the dollar-cost averaged shares would come out ahead in that comparison (with less risk!).
Third, one of the great benefits of dollar-cost averaging is that it spreads risk out over time. That is, instead of trying to guess where the “bottom” of the market is and invest all of one’s money at that time, the risk of over-paying for the stock can be spread out over an extended period of time. Several theories of equity valuation acknowledge that short-term inefficiencies exist in the market and that stocks often trade at a premium (or discount) to their true intrinsic value. However, there are few investors, if any, who have the ability to accurately determine the true intrinsic value of stocks at a particular time. By spreading the money to be invested in stocks over a long time period, the investor reduces his chances of overpaying, on average, for the stocks.
Fourth, by dollar-cost averaging with index funds the investor can avoid having to spend a lot of time/money researching stocks to determine which to purchase. Instead, the investor can simply determine the long-term historical returns/trends for stocks and invest accordingly. For example, I invest according to my Hypothetical Model Portfolio and expect it perform well over time.
The author mentions that if one had invested $100 per month in the Vanguard 500 Index Fund over the past decade, one would currently own shares worth $15,437, a gain of $3,437, or 31.3%, over the total invested amount of $12,000. The author contrasts this with an investment of $12,000 made exactly 10 years ago which would be worth about $26,640, a gain of 122%. The author claims that the disparity between the investor’s actual return of 31.3% and the total 122% return of the S&P 500 over the past 10 years shows that dollar-cost averaging doesn’t always work.
I wholeheartedly disagree with the author’s conclusion. First, the hypothetical investor discussed in the market desires to invest money periodically in the market and probably would not have the entire $12,000 to invest all at one time 10 years ago.
Second, because the dollar-cost averaged shares are purchased over a period of 10 years, the average share of stock would have been purchased only 5 years ago (halfway through the time period), so it’s not really fair to compare that with money invested a full 10 years ago. If the author wanted to make a fair comparison, he would compare the dollar-cost averaged shares purchased versus a lump-sum purchase make exactly 5 years ago, so that both investments have the same average investment time period. Seeing as how the stocks experienced a strong decline in 2001 and 2002, I would bet that the dollar-cost averaged shares would come out ahead in that comparison (with less risk!).
Third, one of the great benefits of dollar-cost averaging is that it spreads risk out over time. That is, instead of trying to guess where the “bottom” of the market is and invest all of one’s money at that time, the risk of over-paying for the stock can be spread out over an extended period of time. Several theories of equity valuation acknowledge that short-term inefficiencies exist in the market and that stocks often trade at a premium (or discount) to their true intrinsic value. However, there are few investors, if any, who have the ability to accurately determine the true intrinsic value of stocks at a particular time. By spreading the money to be invested in stocks over a long time period, the investor reduces his chances of overpaying, on average, for the stocks.
Fourth, by dollar-cost averaging with index funds the investor can avoid having to spend a lot of time/money researching stocks to determine which to purchase. Instead, the investor can simply determine the long-term historical returns/trends for stocks and invest accordingly. For example, I invest according to my Hypothetical Model Portfolio and expect it perform well over time.
Friday, July 07, 2006
June Returns For My Model Long-Term Portfolio
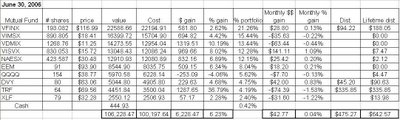
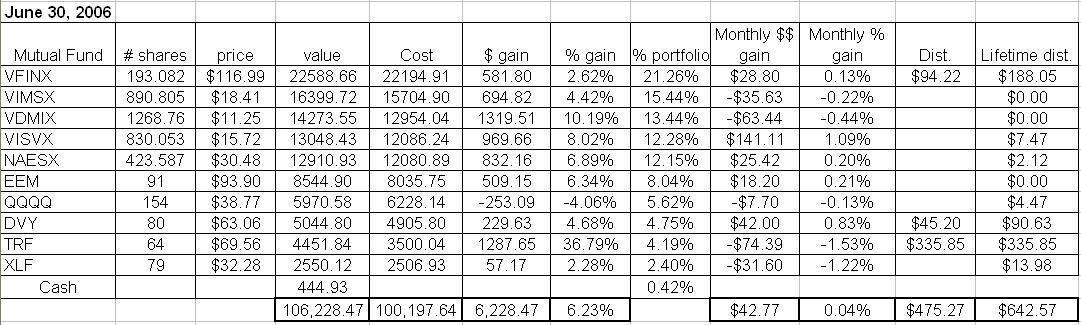
The performance of my Hypothetical Model Portfolio was flat during June. As of the market close on June 30, 2006, the Hypothetical Model Portfolio* increased in value by $42.77, or about 0.04% during June. The Hypothetical Model Portfolio is up $6228.47in 2006, a gain of 6.23%, as shown on the table below (click for a larger image of the table).
The portfolio was down substantially (bottoming near a loss of about $6,000) through most of the first half of June before recovering strongly near the end of the month to finish flat.
The Templeton Russia closed-end fund (TRF) continued to struggle, finishing with a loss of 1.53% for the month after being down about 30% for the month as of June 13th. The second-worst performer was the SPDR Financial components (XLF) which fell 1.22%.
On a positive note, my small cap holdings performed well. The Vanguard Small Cap Value Index (VISVX) was my top performer, returning 1.09% in June. The Vanguard Small Cap Index mutual fund (NAESX) was also positive, returning 0.20%. The Emerging Markets ETF (EEM) was another positive performer, recovering from a disastrous May by returning a respectable a respectable 0.21% in June. The iShares Dow Jones U.S. Select Dividend Index Fund (DVY) also performed well, returning 0.83% during June.
Four of the holdings in my Hypothetical Model Portfolio paid dividends in June. As I mentioned in a previous post, the dividends from mutual fund holdings are reinvested, but the dividends from ETFs or the closed end fund (i.e., the Templeton Russia closed-end fund (TRF)) are not reinvested- they will accumulate as "CASH" on the performance table below. The reason I am doing this is because the index mutual funds in this portfolio do not charge a transaction fee for reinvesting dividends. To reinvent dividends for any of the ETFs or TRF, on the other hand, would cause me to incur transaction fees for the trading commissions.
The Vanguard S&P 500 index fund (VFINX) paid a dividend of $0.49/share (a total of $94.22) which was reinvested on June 23 to purchase an additional 0.805 shares at a price of $116.99/share. DVY paid a dividend of $0.56501 on June 28 (a total of $45.20) which was moved to "CASH" on the table shown below. TRF paid a long-term distribution of $5.2476/share on June 19 (a total of $335.85) that was also moved to "CASH" on the table below.
The economy continues to hum along despite the FED interest rate increases. I suspect that the FED will raise rates a couple more times and then be done with it. Hopefully the market will finally surge at that time.
*The Hypothetical Model Portfolio was hypothetically created with an investment of $100,000 with investments made as of the closing values on December 30, 2005. The reason why the total cost in the chart is greater than $100,000 is because the total cost accounts for the value of dividends reinvested into the mutual funds in the portfolio.
The portfolio was down substantially (bottoming near a loss of about $6,000) through most of the first half of June before recovering strongly near the end of the month to finish flat.
The Templeton Russia closed-end fund (TRF) continued to struggle, finishing with a loss of 1.53% for the month after being down about 30% for the month as of June 13th. The second-worst performer was the SPDR Financial components (XLF) which fell 1.22%.
On a positive note, my small cap holdings performed well. The Vanguard Small Cap Value Index (VISVX) was my top performer, returning 1.09% in June. The Vanguard Small Cap Index mutual fund (NAESX) was also positive, returning 0.20%. The Emerging Markets ETF (EEM) was another positive performer, recovering from a disastrous May by returning a respectable a respectable 0.21% in June. The iShares Dow Jones U.S. Select Dividend Index Fund (DVY) also performed well, returning 0.83% during June.
Four of the holdings in my Hypothetical Model Portfolio paid dividends in June. As I mentioned in a previous post, the dividends from mutual fund holdings are reinvested, but the dividends from ETFs or the closed end fund (i.e., the Templeton Russia closed-end fund (TRF)) are not reinvested- they will accumulate as "CASH" on the performance table below. The reason I am doing this is because the index mutual funds in this portfolio do not charge a transaction fee for reinvesting dividends. To reinvent dividends for any of the ETFs or TRF, on the other hand, would cause me to incur transaction fees for the trading commissions.
The Vanguard S&P 500 index fund (VFINX) paid a dividend of $0.49/share (a total of $94.22) which was reinvested on June 23 to purchase an additional 0.805 shares at a price of $116.99/share. DVY paid a dividend of $0.56501 on June 28 (a total of $45.20) which was moved to "CASH" on the table shown below. TRF paid a long-term distribution of $5.2476/share on June 19 (a total of $335.85) that was also moved to "CASH" on the table below.
The economy continues to hum along despite the FED interest rate increases. I suspect that the FED will raise rates a couple more times and then be done with it. Hopefully the market will finally surge at that time.
*The Hypothetical Model Portfolio was hypothetically created with an investment of $100,000 with investments made as of the closing values on December 30, 2005. The reason why the total cost in the chart is greater than $100,000 is because the total cost accounts for the value of dividends reinvested into the mutual funds in the portfolio.
Thursday, June 29, 2006
Emigrant Direct Raises Its Money Market Interest Rate to 4.80%
I just saw an online advertisment for Emigrant Direct which indicates that they have raised their money market interest rate to 4.80%. I'm not sure if they raised their money market interest rate today, but it must have happened sometime within the past few days. Emigrant Direct now pays more than half a percent more than INGDirect, which currently pays a paltry 4.25%.
Tuesday, June 27, 2006
Robert Kiyosaki Has Written Another Flimsy Article For Yahoo Finance
Robert Kiyosaki has once again written an article for his Yahoo Finance column that has gotten me all riled up. (See my previous post - "Robert Kiyosaki Is A Blowhard.") This one is entitled “Why Mutual Funds Are Lousy Long-Term Investments.”
He basically attempts to argue that mutual funds are wastes of money because of the fees they charge. He borrows quite a bit from an interview given by Vanguard founder John Bogle in which Bogle mentioned that mutual funds charging high fees are doing a disservice to most investors because the investors take 100% of the risk, put up 100% of the amount to be invested, but over time make quite a bit of money for the companies offering the mutual funds.
That’s fine and I do not disagree with that allegation. Bogle thinks that actively managed funs generally charge too much and that most investors would instead be better served investing in index-tracking funds. I also agree with Bogle on that point.
However, after spending about half of his “article” directly quoting Bogle, Kiyosaki mentions that he dislikes index funds because “[m]ost index funds think a 10 percent to 25 percent return is a good rate.” Kiyosaki also writes “[a]ctive investors can regularly beat those gains, especially if they stay away from traditional investments such as savings, stocks, bonds, and index and mutual funds.”
I don’t know what Kiyosaki is talking about, because as far as I know, there are only a handful of top money managers capable of providing consistent returns greater than 10-25% annually, and Kiyosaki is not one of them. The vast majority of investors (including yours truly) would be very happy to own a portfolio of mutual funds returning 10-25% per year.
Kiyosaki has a tendency to trump certain investing styles after they have already come into fashion and then mention that he has been investing in them and recommending them for years without any corresponding documentation. It is always the same with this guy – he’s a salesman, and based on his book sales he’s a good salesman at that, but he’s not the big-time investor he attempts to make himself out to be.
Although he has previously stated that the “rich dad” discussed in his books is a real person with was his financial mentor when growing up, he has never providing that individual’s name, and nobody has ever been able to find even a scintilla of evidence that this alleged “rich dad” even exists outside of Kioysaki’s mind.
Also, I know that he’s been trumpeting precious metals and energy stocks lately, but was he really buying them en mass in 2002 when money managers shunned them and they sat at historically low valuations? I certainly doubt it.
His column and books may be entertaining but take everything he writes with a grain of salt, as 90% of the personal stories in them are almost certainly fabricated, as discussed on this website.
He basically attempts to argue that mutual funds are wastes of money because of the fees they charge. He borrows quite a bit from an interview given by Vanguard founder John Bogle in which Bogle mentioned that mutual funds charging high fees are doing a disservice to most investors because the investors take 100% of the risk, put up 100% of the amount to be invested, but over time make quite a bit of money for the companies offering the mutual funds.
That’s fine and I do not disagree with that allegation. Bogle thinks that actively managed funs generally charge too much and that most investors would instead be better served investing in index-tracking funds. I also agree with Bogle on that point.
However, after spending about half of his “article” directly quoting Bogle, Kiyosaki mentions that he dislikes index funds because “[m]ost index funds think a 10 percent to 25 percent return is a good rate.” Kiyosaki also writes “[a]ctive investors can regularly beat those gains, especially if they stay away from traditional investments such as savings, stocks, bonds, and index and mutual funds.”
I don’t know what Kiyosaki is talking about, because as far as I know, there are only a handful of top money managers capable of providing consistent returns greater than 10-25% annually, and Kiyosaki is not one of them. The vast majority of investors (including yours truly) would be very happy to own a portfolio of mutual funds returning 10-25% per year.
Kiyosaki has a tendency to trump certain investing styles after they have already come into fashion and then mention that he has been investing in them and recommending them for years without any corresponding documentation. It is always the same with this guy – he’s a salesman, and based on his book sales he’s a good salesman at that, but he’s not the big-time investor he attempts to make himself out to be.
Although he has previously stated that the “rich dad” discussed in his books is a real person with was his financial mentor when growing up, he has never providing that individual’s name, and nobody has ever been able to find even a scintilla of evidence that this alleged “rich dad” even exists outside of Kioysaki’s mind.
Also, I know that he’s been trumpeting precious metals and energy stocks lately, but was he really buying them en mass in 2002 when money managers shunned them and they sat at historically low valuations? I certainly doubt it.
His column and books may be entertaining but take everything he writes with a grain of salt, as 90% of the personal stories in them are almost certainly fabricated, as discussed on this website.
The Nasdaq 100 ETF (QQQQ) Is Paying A Quarterly Dividend On July 31, 2006
The Nasdaq 100 ETF (symbol: QQQQ) is paying a dividend of $0.0257 per share on July 31, 2006. This dividend is being paid to shareholders of record as of June 20, 2006.
As with QQQQ's previous distribution in April 2006, it took me awhile to find the actual distribution date of this dividend. Yahoo Finance had indicated that the dividend was declared on June 16, 2006, but it did not list when the payout date would be. I was finally able to determine the payout date after some searching on Google and finding this article.
As with QQQQ's previous distribution in April 2006, it took me awhile to find the actual distribution date of this dividend. Yahoo Finance had indicated that the dividend was declared on June 16, 2006, but it did not list when the payout date would be. I was finally able to determine the payout date after some searching on Google and finding this article.
Subscribe to:
Posts (Atom)