Sunday, March 11, 2007

February 2007 Returns For My Model Long-Term Portfolio

February was a very volatile month for my Hypothetical Model Portfolio. The portfolio was performing very well until February 27th when the market corrected with the Dow dropping about 3.3% (416 points), the S&P 500 index dropping about 3.5%, and the NASDAQ composite dropping about 3.9%.

As of the market close on February 28, 2007, the Hypothetical Model Portfolio* decreased in value by $1684.95, or about 1.14% during the month of February. However, despite February's lousy returns, the Hypothetical Model Portfolio is still up about $84.57 in 2007, a gain of 0.06%, as shown on the table below (click for a larger image of the table).

Only two of the holdings failed to decrease in value - the Vanguard Developed Markets Index mutual fund (VDMIX) and the Vanguard Mid Cap Index (VIMSX). VDMIX rose about 0.31% and VIMSX closed the month at the same price at which it ended in January. VIMSX has performed surprisingly well so far this year and is up about 3.65% through the end of February.

Emerging markets were the worst performers, with the Templeton Russia closed-end fund (TRF) decreasing by about 4.40% and the iShares Emerging Markets ETF (EEM) dropping about 3.98%. The only other holding to drop more than 3% was S&P 500 Financial components ETF (XLF), which fell about 3.05%. TRF has now dropped about 18.85% during the first two months of 2007. The primary reason for TRF's poor performance is compression of its closed-end Net Asset Value premium, as I have previously discussed.

It seems as though 2007 is going to be a volatile year. However, stock market valuations, especially those of U.S. markets, are still right around historical averages. Consequently, I don't see a huge sustained market drop happening anytime soon. I still anticipate my Hypothetical Model Portfolio performing well in 2007 and note that despite the February market turbulence, the Hypothetical Model Portfolio is outperforming the S&P 500 Index by about 0.57%.


*The Hypothetical Model Portfolio was created with an investment of $100,000 in securities as of the closing values on December 30, 2005 and an additional $25,000 was invested n securities as of the closing values on December 29, 2006. The reason why the total cost in the chart is greater than $125,000 is because the total cost accounts for the value of distributions reinvested into the mutual funds in the portfolio.

January 2007 Returns

Saturday, March 10, 2007

The NAV Premium For The Templeton Russia Fund (TRF) Has Plummeted in 2007

The Templeton Russia and Eastern Europe closed-end fund (symbol: TRF) has plummeted since the start of 2007. This has happened despite the fact that the Russia stock market has been strong so far this year. As of February 28, 2007, TRF is down 18.85%, dropping from $87.30 to $70.84 since the start of 2007. The Net Asset Value ("NAV") of TRF, on the other hand, has risen 2.96%, from $63.23 to $65.08. A chart of the TRF share price and its NAV is shown below (FYI, I copied this chart from ETF Connect).

As I have discussed previously, closed end funds almost always trade at a discount or premium to their NAVs. The vast majority of closed end funds trade at a discount to their NAVs. TRF is one of the rare ones that typically trades at a premium. Between the start of 2007 and February 28, 2007, TRF's premium dropped from 38.07% to 8.85%, a drop of nearly 30%, as shown below.
I suspect that most of the compression in TRF's share price is over. TRF has typically traded at a premium of around 10-15% over the past few years and I see no reason as to why this trend will be broken now.

Wednesday, February 28, 2007

The New Presidential Dollar Coins Are Hard To Find

As I have posted previously, I collect pre-1982 pennies and all nickels because their intrinsic values (i.e. melt values) exceeds their respective face values. As of today, February 28, 2007, a pre-1982 penny has an intrinsic value of about 1.8254 cents (i.e., 182.54% of its face value) and a nickel has an intrinsic value of about 7.80 cents (i.e., about 156.01% of its face value). (See Coinflation.com.) I wouldn't call myself a serious collector, although I do save these coins when I receive them in change.

I enjoy collecting coins because coins are piece of American history. From a certain point of view they are small and readily accessible pieces of art. As such, I was really looking forward to the unveiling of the new Presidential dollar coins which were released on February 15, 2007. The first Presidential dollar coin contains a picture of the first president of the United States, George Washington.


Unfortunately, the new dollar coins are hard to find. The U.S. Mint is supposedly making 300 million of them, but I have yet to see one of them. I have been to three bank branches over the past three weeks, but each one has been out of the new coins. I was informed today that the branch I most recently visited had received a big box of the coins but that they were quickly snapped up by customers. I assume that this means that some people are hoarding a lot of these coins. I generally don't have a problem with people hoarding coins, as I do the same. However, I really wish banks would set limits on how many of these coins they sell to individual customers, as it doesn't seem right that someone can purchase hundreds of dollars of the new coins and then turn around and sell them on eBay or in a coin shop at a premium price.

Thursday, February 15, 2007

The Motley Fool Has Lost A Lot Of Credibility Over the Past Few Years

During the mid- to late 1990s I was a relative novice when it came to stock market investing. I read several books in the late 1990s to increase my investing knowledge base and frequented the Motley Fool website. The Motley Fool was a great resource at the time. The founders of the website would post various stock market-related articles daily and really seemed to be champions of the small investors.

The Motley Fool used to track several different portfolios on the website and would provide daily updates to inform readers as to how well their holdings did on a particular day. The portfolios were interesting because the Motley Fool would notify everyone before they purchased a stock and all purchases were made with real money. The portfolios were loaded with tech stocks and performed phenominally well throughout the 1990s. As I recall they started tracking the first of the portfolios in 1994 and continued tracking the portfolios until the 2001 or 2002 when the portfolios took major hits during the terrible bear market.

The Motley Fool writers often railed against the mutual fund industry for charging exorbitant fees relative to the returns they provided. They were also strong advocates of index funds and often explained why it was almost impossible to beat the various indices over time with an actively managed mutual fund.

Unfortunately, times have changed for the Motley Fool. For the past three or four years the Motley Fool seems to be more concerned with making money off advertsiing and selling its own products than educating investors. For example, the website's current view of mutual funds is radically different than it was in the 1990s - the Motley Fool now advocates investing in the actively managed mutual funds it once shunned and sells a product entitled "Champion Funds" for $149 that recommends various actively-mutual funds to be purchased.

The Motley Fool also has a nasty (and annoying) habit of recycling old articles. I check stock and mutual fund quotes on Yahoo! Finance every day. Yahoo! Finance lists the five or so most recent relevant articles for each of the stocks and mutual funds I check. To ensure that its website is in the top five, the Motley Fool often takes an article that first appeared on its website months ago and updates maybe one paragraph and links it to Yahoo! Finance as a new article. They frequently do this for articles relating to dividends.

It's really a shame that the Motely Fool website has gone downhill. Don't get me wrong - there's still a lot of good information on that website. However, one needs to take what is written over there with a grain of salt because it seems as though making money off of the website is now priority #1 for the Motley Fool.

Sunday, February 11, 2007

January 2007 Returns For My Model Long-Term Portfolio

January 2007 was decent month for my Hypothetical Model Portfolio, despite trailing the broader market returns. As of the market close on January 31, 2007, the Hypothetical Model Portfolio* increased in value by $1769.52, or about 1.22% during the month of January. The Hypothetical Model Portfolio has now gained a total of $22,246 since it was created in January 2006 with $100,000 and an additional $25,000 was added at the beginning of 2007.

Midcaps led the way during January, with the Vanguard Mid Cap Index Fund (VIMSX) rising about 3.65%. It would be nice if midcaps have a strong year in 2007, as they trailed the S&P 500 by about two percentage points during 2006. The next strongest performers in the portfolio were small caps and tech stocks. The Vanguard Small Cap Index (NAESX) rose about 2.40%, the Vanguard Small Cap Value Index (VISVX) rose about 2.01%, and the Nasdaq 100 ETF (QQQQ) rose about 2.11%.

The weakest returns were turned in by the Templeton Russia closed-end fund (TRF) and the iShares Emerging Markets ETF (EEM). TRF plummeted about 15.12% and EEM rose a paltry 0.11%. The Russia stock market was steady during January and the value of the Russian and Eastern European stocks held by TRF was also steady. However, as I have discussed previously, closed-end funds typically trade at a variable premium or discount to their underlying Net Asset Value ("NAV"). According to ETF Connect, TRF traded at a 38.07% premium to its NAV at the end of December 2006 and at a 17.63% premium on January 31, 2007. TRF has traded at an average premium of around 10-15% since its inception in 1995 so TRF's premium compression is probably about over for now. If Russian and Eastern European stocks perform well this year TRF should provide another solid year of returns.

TRF paid a distribution of $566.33 on January 16, 2007. This distribution was declared at the end of December 2006 and I listed this as a "pending distribution" in the portfolio chart for December. As I mentioned in my earlier post regarding my 2007 portfolio rebalancing, this distribution was reinvested in the Vanguard mutual funds in the portfolio because these funds do not charge a transaction fee. On January 17, 2007, the following purchases were made with this distribution:
  • Vanguard Index 500 mutual fund (symbol: VFINX): 1.262 shares at $131.81/share, a total investment of $166.33
  • Vanguard Midcap Index mutual fund (symbol: VIMSX): 4.970 shares at $20.12/share, a total investment of $100.00
  • Vanguard Developed Markets Index mutual fund (symbol: VDMIX): 7.930 shares at $12.61/share, a total investment of $100.00
  • Vanguard Small Cap Index mutual fund (symbol: NAESX): 3.045 shares at $32.84/share, a total investment of $100.00
  • Vanguard Small Cap Value Index mutual fund (symbol: VISVX): 5.862 shares at $17.06/share, a total investment of $100.00


*The Hypothetical Model Portfolio was created with an investment of $100,000 in securities as of the closing values on December 30, 2005 and an additional $25,000 was invested n securities as of the closing values on December 29, 2006. The reason why the total cost in the chart is greater than $125,000 is because the total cost accounts for the value of distributions reinvested into the mutual funds in the portfolio.

December 2006 Returns

Sunday, February 04, 2007

Updated Model Long-Term Portfolio For 2007

As I mentioned in my post discussing the December 2006 returns for my Hypothetical Model Portfolio, I have added another $25,000 to this portfolio. This money is allocated according to the original portfolio allocation discussed in my January 2006 post regarding the creation of this portfolio. In short, this money is being added to rebalance the portfolio. My rules of rebalancing are that I will not sell any of the holdings, although I am allowed to purchase additional shares. Although this is a purely hypothetical portfolio, I have attempted to make this as realistic as possible and do account for trading commissions that would normally be incurred. In my portfolio, commissions would be incurred when purchasing any of the ETFs or the closed end fund. There are no commissions, on the other hand, for purchasing additional shares of any of the Vanguard index-tracking mutual funds.

As discussed in my last post, the portfolio included $739.97 in CASH (from dividends and capital gains distributions). Accordingly, a total of $25,739.97 is being re-invested at this time. I am not reinvesting the $566.33 in pending distributions for the Templeton Russia Fund (symbol: TRF) because it had not yet been distributed as of the start of 2007. The purchases of the securities in the portfolio were made as of their respective closing prices on December 29, 2006, the last trading day of 2006.

The portfolio includes a total of ten securities and I have purchased shares of nine of the securities in this rebalancing. TRF is the only security for which I did not add additional shares. TRF substantially outperformed the portfolio last year and is actually still overweighted in the portfolio despite the additional of new money.

The following purchases are made with the $25,739,97 I had to invest:
  • Vanguard Index 500 mutual fund (symbol: VFINX): 48.151 shares at $130.59/share, a total investment of $6288.04
  • Vanguard Midcap Index mutual fund (symbol: VIMSX): 242.719 shares at $19.78/share, a total investment of $4800.99
  • Vanguard Developed Markets Index mutual fund (symbol: VDMIX): 188.190 shares at $12.58/share, a total investment of $2367.43
  • Vanguard Small Cap Index mutual fund (symbol: NAESX): 105.816 shares at $32.62/share, a total investment of $3451.71
  • Vanguard Small Cap Value Index mutual fund (symbol: VISVX): 177.484 shares at $17.05/share, a total investment of $3026.11
  • iShares Emerging Market Index ETF (symbol: EEM): 11 shares at $114.17/share + $5 commission (through Ameritrade Izone), a total investment of $1260.87
  • Nasdaq 100 ETF (symbol: QQQQ): 56 shares at $43.16/share + $5 commission, a total investment of $2421.96
  • iShares Dow Jones U.S. Select Dividend Index ETF (symbol: DVY): 20 shares at $70.74/share + $5 commission, a total investment of $1419.80
  • SPDR Financial components ETF (symbol: XLF): 19 shares at $36.74/share + $5 commission, a total investment of $703.06
As discussed in my January 2006 post introducing the Model Long-Term Portfolio, my desired model portfolio allocation is as set forth below (After rebalancing, the portfolio percentages are closer to the desired model portfolio allocation than they were at the end of December 2006. However, it was not possible the exactly match the model portfolio allocation because of TRF's substantial outperformance in 2006. ):

22.000% VFINX
15.700% VIMSX
12.950% VDMIX
12.075% VISVX
12.075% NAESX
8.050% EEM
6.250% QQQQ
4.900% DVY
3.500% TRF
2.500% XLF

The model portfolio after rebalancing is shown in the chart below (click on the image for a larger view)**:


* I have decided that because I am going to add an additional $25,000 at the end of each year to this portfolio, I will reinvest the dividends and distributions from the ETFs and the closed end fund immediately after they are distributed. I will only reinvest this money into the Vanguard index-tracking mutual funds because Vanguard does not charge commissions. The minimum investment for the Vanguard mutual funds is $100, so I will wait until at least $100 has accumulated before reinvesting the dividends and capital gains distributions.

**The total cost of all of the securities in the model portfolio is greater than the total of $125,000 that I initially added (i.e., $100,000 in 2006 and $25,000 in 2007) because $2,168.33 in dividends and capital gains distributions were reinvested. When purchasing new shares with such dividends and capital gains distributions, I added the amount purchased into the "cost" column of the chart shown above. The reason why I did this is because this is how one would need to account for such purchases on a taxable basis, so it makes sense to account for them the same way in this model portfolio.

***The Model Portfolio returned 20.50% in 2006. The way I calculated this was by dividing the $20,476 portfolio gain by $100,000, the total amount initially invested. However, because I added $25,000 in new money to the portfolio, the overall return decreased to 16.38% ($20,476 divided by $125,000) in the chart shown above.

Saturday, January 27, 2007

FED Model - Updated Through January 26, 2007

I wrote a post in February 2006 in which I argued that the S&P 500 was undervalued. Since then, the S&P 500 has risen from about 1283 to 1422, a return of 10.83%, excluding dividends. This is a strong gain and I think that the S&P 500 has further to go. Relative to bonds, the S&P 500 still appears to be undervalued.

According to Standard & Poor's, the projected reported earnings through 12/31/07 for the sum of the components of the S&P 500 is about $89.10/share. As discussed above, the S&P 500 index currently trades at about 1422. Accordingly, the forward P/E ratio of the S&P 500 index is about 15.96* (1422/$89.10). This is slightly higher than the historical P/E ratio of around 14-15. However, bonds are still more richly valued than their historical averages. Other asset classes such as real estate and commodities are also richly valued right now and have been for several years. As I wrote last February, it seems inevitable that stocks will eventually catch up to the performance of these other asset classes.

Stocks have been weighed down over the past couple years in large part due to high energy prices and a FED that had been steadily raising short-term interest rates. However, consumer price inflation is still low and bonds are expensive relative to historical averages. The yield on the 10-yr US bond is currently about 4.88%. The earnings yield on the S&P 500 based on estimated 2007 earnings* is about 6.27% (i.e., the inverse of the 15.96 P/E ratio). The earnings yield on the S&P 500 is therefore about 1.45% higher than the 10-yr bond yield. This is still a large disparity and will probably shrink over the next few years as the S&P 500 outperforms the 10-yr bond.

2007 should continue to be a good year for the S&P 500. The S&P 500 probably won't increase in value every month, but even after accounting for a pullback or two this should be a good year nevertheless.

* I used estimated "as reported" earnings in calculating the 2007 estimated earnings. Many stock market analysts use estimated "operating earnings" in calculating forward P/E ratios. The "as reported" earnings account for miscellaneous supposedly non-recurring "one-time" charges and expenses deducted from operating earnings. The "as reported" earnings provide a more realistic estimate of earnings because such miscellaneous non-recurring "one-time" charges and expenses occur every single year. It seems disingenuous to not factor them into the calculation of the forward P/E ratio.

Sunday, January 21, 2007

S&P 500 Dividends (Updated through January 2007)

In February 2006 I wrote a post about S&P 500 dividends. I've decided it is time to update the chart to include dividend information for the full 2006 year. The dividend information is available at the Standard & Poor's website.

The chart shown below (click on the chart to see a larger image) illustrates dividend information for the S&P 500 from 1988-2006. As shown, the dividends paid by the S&P 500 component companies increased from $9.73 in 1988 to $24.88 in 2005. That works out to a total increase of 155.7% and an average annual increase of 5.354% in the dividend yield. Considering that this time period includes the horrible bear market from 2000 to 2002 when the S&P 500 lost about 50% of its value, I would say that the annual increase is impressive.

As shown in the chart below, the annual % increase of dividends has been increasing very rapidly since 2002. That is due both to the strong corporate profits over the past few years and the dividend tax decrease that Congress passed in 2003. According to Standard & Poor's, the dividends are projected to increase to $27.35 for 2007, a 9.928% increase over 2006.

I still anticipate large % increases in the dividend rate in the coming years. As I mentioned in my 2006 post on S&P 500 dividends, companies are going to continue to be pressured to continue raising dividends due to the combination of favorable tax treatment and the fact that Baby Boomers are nearing retirement age and are going to want extra dividend income and will pressure companies to keep raising dividends. The great benefit of dividends is that they provide investors with a return without forcing the investors to sell at inopportune moments to realize these returns.


***An updated version of this chart containing data from 1977-2014 may be found in this post.

Wednesday, January 17, 2007

1980 - 2006 Stock Market Returns for Various Indices

I often read articles written by stock market pundits who argue that now is the time for growth stocks to outperform value stocks. Value stocks have trounced growth stocks since 2000 and it's time for the growth to finally beat the value stocks again, or at least that is what we are told. It is true that investment styles are cyclical, but I really question whether an investor would be better off listening to the pundits and trying to time such market reversals of fortune.

While sleuthing around on the Internet I came across some old versions of the Callan Periodic Table of Investment Returns that I have posted previously. I entered all of the data I found from 1980-2006 into a spreadsheet for small cap indices (Russell 2000, Russell 2000 Value, and Russell 2000 Growth), large cap indices (S&P 500, S&P/Citi 500 Value*, and S&P/Citi 500 Growth*), a broad-based foreign stock index(Morgan Stanley Capital International Index for the developed stock markets of Europe, Australasia, and the Far East ("MSCI EAFE index")), and an index of bonds (Lehman Brothers Aggregate Bond Index ("LB Agg.")).

As shown in the chart below (click on the image for a larger view), the Russell 2000 Value index has outperformed all other investment styles over the time frame, returning 4522.32%, which is an average annual return of 15.26%. The Russell 2000 Growth Index was the worst performer, on the other hand, providing a total return of just 937.98% over the time period, or about 9.05% per year. The formidable return of the Russell 2000 Value index is not surprising, considering that Small Cap Value stocks have routinely outperformed other investment styles over long periods of time as I have previously discussed.

What is surprising is just how poor the returns were for the Small Cap Growth stocks in the Russell 2000 Growth index - for all of the risk involved, investors are not adequately compensated, seeing as how the LB Agg. Index returned 948.45% over the time period, an average annual return of about 9.09% with far less risk.

Another thing I found surprising is that the S&P 500 Index provided much larger returns that the overall Russell 2000 Index. Small cap stocks absolutely trounced large caps during the 1970s, so I guess this is to be expected.

An additional item of interest is the return of the MSCI EAFE Index versus the S&P 500. As shown, the MSCI EAFE Index returned 1849.57%, or an average annual return of 11.63% during the time period. The S&P 500 provided much larger returns - a total return of 2802.82%, or an average of 13.29% between 1980 and 2006. I expect that the MSCI EAFE Index will catch up to the S&P 500's performance in the future, given that the U.S. runs an enormous trade deficit with the rest of the world and the U.S. dollar will inevitably weaken.


* The older charts I found provide data for the S&P/Barra 500 Value Index and the S&P/Barra 500 Value Index, instead of the S&P/Citi 500 Value and Growth Indices, respectively, during the time period from 1980-1986. I'm not sure whether the older S&P/Barra indices are substantially the same as the S&P/Citi indices, but they appear to be so.

 *** Edit - January 21, 2014 ***
I have updated this chart with results through 2013.

Friday, January 12, 2007

Updated "Periodic Table" of Equity Style Investment Returns Through 2006

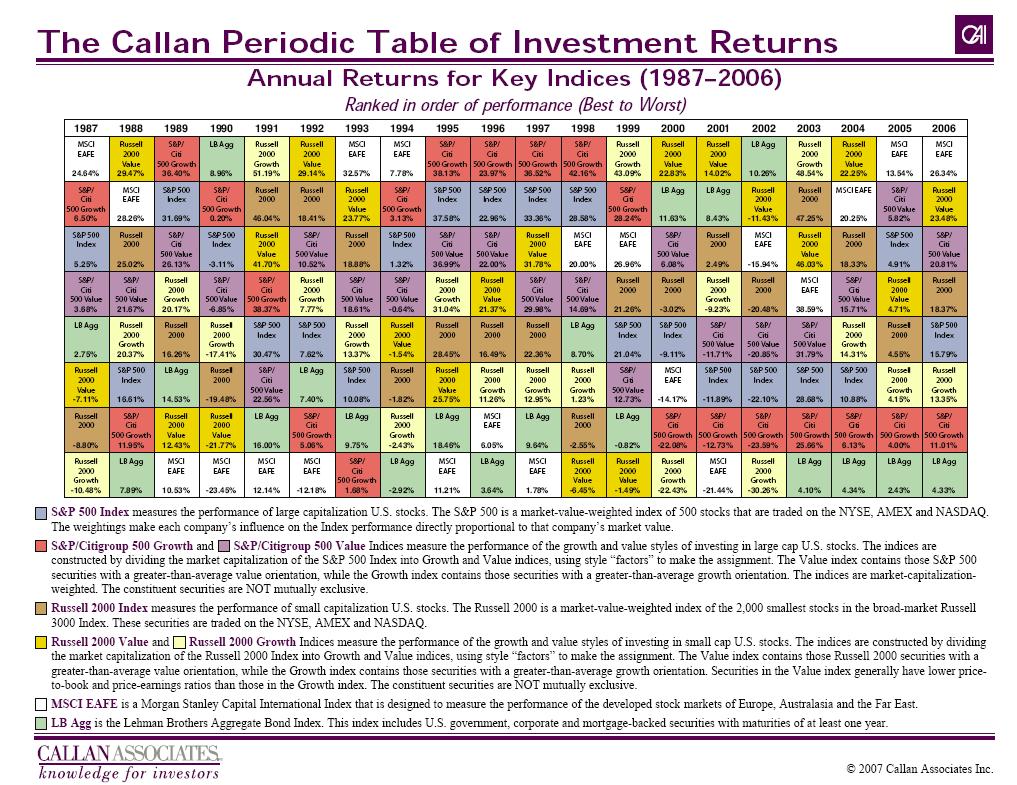
Posted below is an updated version of the "Periodic Table" of equity style investment returns from 1987-2006. (Click on the image below to see a larger version of the Periodic Table.) This chart was originally posted on the website for Callan Associates.


*If the image is fuzzy, you can see a .pdf of the image here.

I have written a new post with results from 1989-2008.

Thursday, January 04, 2007

2006 Global Stock Market Returns

The Wall Street Journal Online has an interesting article about 2006 global stock market returns. The U.S. had respectable returns of about 13.86% during 2006, but this pales in comparison to the returns of the stock markets of many other countries, including the BRIC countries of Brazil, Russia, India, and China, as shown in the chart below:

Wednesday, January 03, 2007

The First BRIC ETF Was Launched In September

In 2003 Goldman Sachs published a report on the top emerging markets for the next 50 years - Brazil, Russia, India, and China (collectively known as "BRIC"). In the report Goldman Sachs projected that the BRIC countries will grow much faster than any of the current developed markets (including the U.S., Japan, Germany, the U.K., Italy, and France) and the local currencies of the BRIC countries will appreciate some 100-300% against those of the developed markets.

I have been waiting for an ETF to be introduced that invests only in the BRIC countries. Unfortunately there was none until very recently. The best that a small investor could do was to purchase a broad-based emerging markets ETF such as the iShares MSCI Emerging Markets Index Fund ("EEM") that invests in the BRIC countries as well as many other countries, including South Korea and Taiwan. Alternatively, one could also invest in country-specific ETFs and closed-end funds, such as the iShares MSCI Brazil Index Fund ("EWZ"), iShares FTSE/Xinhua China 25 Index Fund ("FXI"), Templeton Russia & East European Fund ("TRF"), and Morgan Stanley India Investment Fund ("IIF").

Luckily, the first BRIC ETF has finally been introduced. During mid-September 2006, the Claymore BRIC ETF was unveiled. The Claymore BRIC ETF invests solely in the BRIC countries and tracks the Bank of New York's BRIC Select ADR Index. Unfortunately, the BRIC ETF does not invest evenly in the BRIC countries - about 48% of the assets are in Brazil, 31% in China, close to 14% in India, but just 6% in Russia. Moreover, the ETF's assets are highly concentrated among a handful of stocks - the ETF owns both common and preferred shares of the Brazilian company Petroleo Brasileiro (symbol: PBR) totaling 15.53% of the ETF's net assets.

Although I am glad to finally see a BRIC ETF, I'm going to sit on the sidelines. I don't like the uneven investment in the BRIC countries, with the investment in Brazilian companies being nearly eight times as large as the investment in Russian stocks. For the time being, I will continue to invest in EEM and the country-specific ETFs and country-specific closed-end funds I listed above.

Monday, January 01, 2007

December 2006 Returns For My Model Long-Term Portfolio

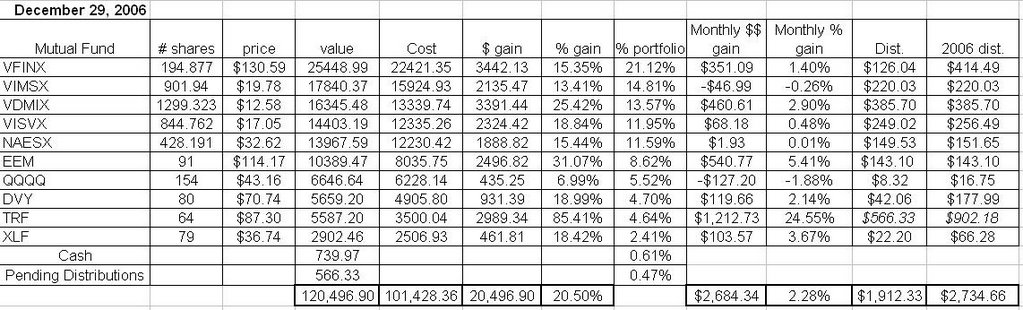
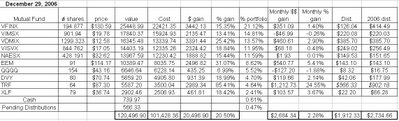
December was yet another solid month for my Hypothetical Model Portfolio. As of the market close on December 29, 2006, the Hypothetical Model Portfolio* increased in value by $2684.34, or about 2.28% during the month of December. The Hypothetical Model Portfolio closed up $20,496.90 in 2006, a gain of about 20.50%, as shown on the table below (click for a larger image of the table).

Emerging markets led the way in December and were the overall winners in my portfolio for the 2006-year. The Templeton Russia closed-end fund (TRF) rose over 24% in December and finished 2006 up a whopping 85%, and the iShares Emerging Markets ETF (EEM) returned about 5.4%, finishing the year up just over 31%. My third-best performer in 2006 was the Vanguard Developed Markets Index mutual fund (VDMIX), which rose about 2.9% in December and finished 2006 up about 25.4%. Dividend-paying stocks also performed well during December, with S&P 500 Financial components ETF (XLF) returning about 3.6% and the iShares Dow Jones U.S. Select Dividend Index Fund (DVY) rising about 2.1%.

As discussed above, the foreign holdings (i.e., TRF, EEM, and VDMIX) powered the portfolio during 2006. The only real dog of the portfolio was the Nasdaq 100 ETF (QQQQ), which rose just under 7% during 2006, trailing the overall performance of the portfolio by about 13.5%.

Nine of the ten holdings in the portfolio paid distributions during December. TRF was the only holding to not pay a distribution. However, distributions were deducted from the share price for TRF at the end of December. The TRF distributions will be paid out during the middle of January. Because the distribution is large (greater than $500), I have included the January 2007 TRF distributions in the December 2006 returns for TRF and labeled them "pending distributions."

Regarding the rest of the holdings, the dividends from mutual fund holdings were reinvested, but the dividends from the ETFs were not reinvested- they were accumulated as "CASH" on the performance table below, for the reasons set forth in a previous post. The Vanguard S&P 500 Index fund (VFINX) paid a dividend of $0.65/share (a total of $126.04), which was reinvested on December 27th to purchase an additional 0.966 shares at a price of $130.43/share. The Vanguard Mid Cap Index Fund (VIMSX) paid a dividend of $0.247/share (a total of $220.03), which was reinvested on December 22nd to purchase an additional 11.135 shares at a price of $19.76/share. The Vanguard Developed Markets Index mutual fund (VDMIX) paid a dividend of $0.299/share and a short-term capital gain of $0.005/share (a total of $385.70), which was reinvested on December 29th to purchase an additional 30.563 shares at a price of $12.62/share. The Vanguard Small Cap Value Index (VISVX) paid a dividend of $0.30/share (a total of $249.02), which was reinvested on December 22nd to purchase an additional 14.709 shares at a price of $16.93/share. The Vanguard Small Cap Index (NAESX) paid a dividend of $0.353/share (a total of $149.53), which was reinvested on December 22nd to purchase an additional 4.604 shares at a price of $32.48/share.

The ETFs listed below each paid a distribution that was invested in "CASH" as shown in the chart below. EEM paid a dividend of $1.57251/share (a total of $143.10) on December 29th. QQQQ paid a dividend of $0.054/share (a total of $8.32) on December 29th. DVY paid a dividend of $0.52572/share (a total of $42.06) on December 27th. XLF paid a dividend of $0.28103/share (a total of $22.20) on December 27th. Finally, a distribution of $8.8489 was deducted from the TRF share price on December 27th and will be paid on January 16, 2006.

My Hypothetical Model Portfolio beat the S&P 500 index by about 5 percentage points during 2006. This is an impressive performance. I concede that the Hypothetical Model Portfolio will underperform the S&P 500 index from time-to-time, but it should outperform the S&P 500 index over the long-term. For the 2007 investing year, I intend to add another $25,000 to the Hypothetical Model Portfolio and invest this money and the money listed as "CASH" below according to the same allocations as were outlined in my original post in which I introduced my Hypothetical Model Portfolio. I will discuss the purchase of new shares in a subsequent post.

*The Hypothetical Model Portfolio was hypothetically created with an investment of $100,000 with investments made as of the closing values on December 30, 2005. The reason why the total cost in the chart is greater than $100,000 is because the total cost accounts for the value of dividends reinvested into the mutual funds in the portfolio.


November 2006 Returns

Thursday, December 14, 2006

The U.S. Mint Is Implementing A New Rule Abolishing the Melting of Pennies and Nickels

I have mentioned several times over the past year that I am hording pennies and nickels. We are currently in the midst of a commodities boom and the value of precious metals and non-precious metals (such as those used in current U.S. coins) has soared for the past 2 or 3 years. There are several reasons for the soaring prices that I will not discuss in detail here in this post (although I may discuss it in a future post), but among the chief reasons for this boom is the strong global demand for metals due to strong worldwide economic growth, as well as a devaluation of the U.S. dollar by the Federal Reserve that has increase the U.S. dollar value of commodities.

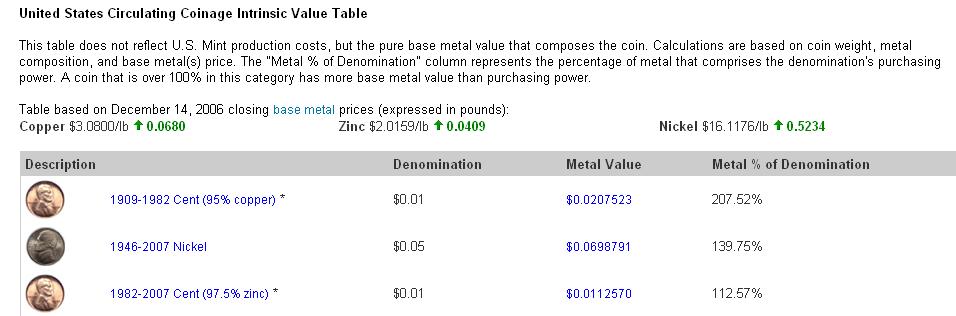
The value of the metals within several U.S. coins, including pennies and nickels, now exceeds the face value of the coins, as shown in the picture below that I acquired from coinflation.com, the best website I've seen for determining the intrinsic metal of various coins (click on the picture for a larger view). As one can see, the metal value of pre-1982 pennies is now 2.0752 cents (207.52% of face value), post-1982 zinc pennies have a metal value of 1.1257 cents (112.57% of face value), and nickels have a metal value of 6.9879 cents (139.75% of face value).


To realize the intrinsic metal value of these coins, one would need to melt them down to separate out the respective valuable metals. Up until yesterday, my understanding was that this practice was not illegal. I've never done so myself or heard of anyone actually doing so, but I read somewhere that this practice would not be prohibited.

The U.S. Mint has apparently been losing money by making pennies and nickels over the past year as it pays more for the metals used to make the coins that it receives in return when it sells the coins at face value to banks, etc. As of today, the U.S. Mint has made it illegal to melt down pennies and nickels. It is also illegal to transport more than $100 worth of pennies and/or nickels out of the country unless it is for legitimate coinage purposes. The penalty for violation of this new rule is a penalty of up to five years in prison and a fine of up to $10,000 for people convicted of violating the rule.

In case anyone had any doubts about whether collecting pennies and nickels is worthwhile, the U.S. Mint's implementation of the new rule should quell such doubts. It's only a matter of time until the U.S. Mint changes the metal composition of pennies and nickels to include less expensive metals, a move that would likely increase the collectible value of current pennies and nickels.

Thursday, December 07, 2006

November 2006 Returns For My Model Long-Term Portfolio

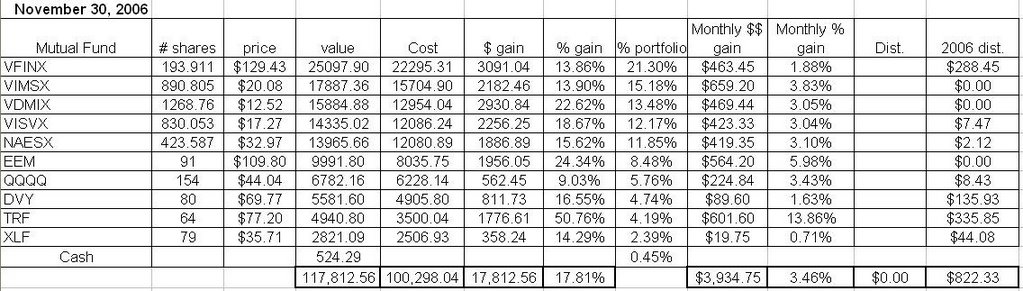
November was another great month for my Hypothetical Model Portfolio. As of the market close on November 30, 2006, the Hypothetical Model Portfolio* increased in value by $3934.75, or about 3.46% during the month of November. The Hypothetical Model Portfolio is now up $17,812.56 in 2006, a gain of 17.81%, as shown on the table below (click for a larger image of the table).

Emerging markets led the way in November, with the Templeton Russia closed-end fund (TRF)appreciating about 13.86% and the iShares Emerging Markets ETF (EEM) returning about 5.98%. Mid caps, small caps, and tech stocks were also strong performers. The Vanguard Mid Cap Index (VIMSX), the Vanguard Small Cap Index (NAESX), Vanguard Small Cap Value Index (VISVX), and the Nasdaq 100 ETF (QQQQ) rose 3.83%, 3.04%, 3.10%, and 3.43%, respectively. The only other ETF or fund to return more than 3% in November was the Vanguard Developed Markets Index mutual fund (VDMIX), which returned about 3.83%. (VDMIX tracks the broad-based foreign stock MSCI EAFE index.)

The poorest portfolio performers in November were my holdings that invest in stocks of large cap companies and dividend-focused ETFs. The Vanguard Index 500 fund (VFINX), S&P 500 Financial components ETF (XLF), and iShares Dow Jones U.S. Select Dividend Index Fund (DVY) returned 1.88%, 1.63%, and 0.71%, respectively.

The stock market continues to look strong as 2006 comes to an end. With a slight surge in December, my Hypothetical Model Portfolio can close the year up 20%.

*The Hypothetical Model Portfolio was hypothetically created with an investment of $100,000 with investments made as of the closing values on December 30, 2005. The reason why the total cost in the chart is greater than $100,000 is because the total cost accounts for the value of dividends reinvested into the mutual funds in the portfolio.


October 2006 Returns