Many of the people out there who have substantial or rapidly growing stock portfolios probably also own real estate. I personally bought my first property last year. In my opinion, one of the important things to do before making a bid on a home is to do a little research on the prices for which comparable homes have been selling.
As luck would have it, a fantistic new real estate website was released recently. I found out about it a week ago and have used it several times. The name of the website is Zillow.com, and it provides estimates of a home's value as well as esitmates of nearby comparable homes. It also lists the square footage of homes, the most recent property tax bills, and the date and amount of the most recent sale (if within the past 5 or 10 years). There are also maps and charts of the average value of the home over the previous 5-10 years and the average value of all homes in the same zip code over the same time period.
I highly recommend Zillow.com to anyone looking to purchase a home anytime soon.
Tuesday, February 21, 2006


Monday, February 13, 2006
Home Depot Is a “Strong Buy”
I’ve been following the stock price of Home Depot (symbol: HD) on-and-off for about the past 10 years. There was a time in the late 90s when HD had a PE ratio in the 50s and traded as high as 70 back in April 2000. However, the investing world's view of large company growth stocks in general, and HD in particular, has radically changed over the past 6 years or so.
Take a look at this chart of fundamental data for HD from 1999-2005:
A 168% increase in earnings per share since 1999 is astounding! The dividends almost quadrupled during the same time period. The dividend payouts are also increasing at an accelerated rate - HD annouced in January that it is upped its dividend payout by 50% in 2006, to 60 cents per share.
HD's stock price has not gone anywhere since the late 90s, despite the impressive improvement in HD's fundamentals during this time period. Money often flows in and out of certain sectors and styles of stocks from time-to-time. During the mid-late 90s, small company stocks were out of favor as investors focused on large company growth stocks. However, the tide shifted in 2000 and small company growth stocks have generally been favored over large company growth stocks for the past 6 years. However, this trend will eventually reverse itself as it always does.
Wall Street can only ignore HD for so long. Its PE ratio is as low as its been since at least the mid 80s, as one can see in this report from the Value Line. Based on 2006 estimated earnings of $3 per share, HD currently has a rock-bottom forward PE ratio of about 13. It would not surprise me to see its forward PE ratio expand to about 20 over a period of 12-18 months. I do not know when the money will flow back into HD, but it seems inevitable that investors will return. When they do, look for HD to rocket.
Take a look at this chart of fundamental data for HD from 1999-2005:
| 1999 | 2000 | 2001 | 2002 | 2003 | 2004 | 2005 | |
| Sales per share | 16.68 | 19.68 | 22.83 | 25.40 | 27.31 | 33.86 | 37.95 |
| "Cash flow" per share | 1.21 | 1.37 | 1.62 | 1.99 | 2.27 | 2.93 | 3.45 |
| Earnings per share | 1.00 | 1.10 | 1.29 | 1.56 | 1.88 | 2.26 | 2.68 |
| Dividends per share | .11 | .16 | .17 | .21 | .26 | .33 | .40 |
| Book Value per share | 5.36 | 6.46 | 7.71 | 8.64 | 9.44 | 11.19 | 12.40 |
| Common shares outstanding (millions) | 2304.3 | 2323.7 | 2345.9 | 2293.0 | 2373.0 | 2158.7 | 2135.0 |
As one can see, HD's sales, cash flow, earnings per share, dividends, and book value have all risen substantially since 1999. Meanwhile, the number of shares outstanding has fallen due to an aggressive stock buyback plan.
A 168% increase in earnings per share since 1999 is astounding! The dividends almost quadrupled during the same time period. The dividend payouts are also increasing at an accelerated rate - HD annouced in January that it is upped its dividend payout by 50% in 2006, to 60 cents per share.
HD's stock price has not gone anywhere since the late 90s, despite the impressive improvement in HD's fundamentals during this time period. Money often flows in and out of certain sectors and styles of stocks from time-to-time. During the mid-late 90s, small company stocks were out of favor as investors focused on large company growth stocks. However, the tide shifted in 2000 and small company growth stocks have generally been favored over large company growth stocks for the past 6 years. However, this trend will eventually reverse itself as it always does.
Wall Street can only ignore HD for so long. Its PE ratio is as low as its been since at least the mid 80s, as one can see in this report from the Value Line. Based on 2006 estimated earnings of $3 per share, HD currently has a rock-bottom forward PE ratio of about 13. It would not surprise me to see its forward PE ratio expand to about 20 over a period of 12-18 months. I do not know when the money will flow back into HD, but it seems inevitable that investors will return. When they do, look for HD to rocket.
Tuesday, February 07, 2006
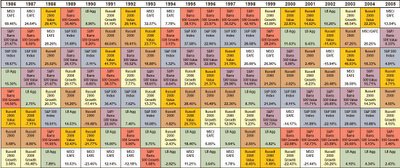
Updated "Periodic Table" of Equity Style Investment Returns Through 2005
Posted below is an updated version of the "Periodic Table" of equity style investment returns from 1986-2005. (Click on the image below to see a larger version of the Periodic Table.) This chart was originally posted on the website for Callan Associates.
*** I have written a new post with results from 1989-2008.

*** I have written a new post with results from 1989-2008.
The Morgan Stanley India Investment Fund
Back in early December I wrote a post about how closed end funds are the best way for small investors to invest in certain foreign markets such as Russia and India, countries for which no country-specific ETFs currently exist. I currently own the Templeton Russia closed-end fund (symbol: TRF) in my own personal account as well as in my hypothetical model portfolio. As I mentioned last week, TRF has performed extremely well for me and is already up around 20% so far in 2006.
I recently decided to see how the Morgan Stanley India Investment closed-end fund (symbol: IIF) has been doing and am amazed at how how well it has been performing. According to ETF connect, as of January 31, 2006 IIF has returned 86.69% for the past year, 76.76% annually over the past 3 years, 39.51% annually over the past 5 years and 22.08% annually over the past 10 years! $1000 invested in IIF 10 years ago would have grown to about $7350. Those returns are phenomenal. I wonder how well IIF will do over the next 10 years...
I recently decided to see how the Morgan Stanley India Investment closed-end fund (symbol: IIF) has been doing and am amazed at how how well it has been performing. According to ETF connect, as of January 31, 2006 IIF has returned 86.69% for the past year, 76.76% annually over the past 3 years, 39.51% annually over the past 5 years and 22.08% annually over the past 10 years! $1000 invested in IIF 10 years ago would have grown to about $7350. Those returns are phenomenal. I wonder how well IIF will do over the next 10 years...
Monday, February 06, 2006
Barron's Dictionary of Finance and Investment Terms
In the late 1990s I was looking at financial and investment books in a mall bookstore when I discovered the Barron's Dictionary of Finance and Investment Terms. This dictionary small enough to fit in one's pocket despite containing definitions for over 5,000 terms. It even contains definitions of abbreviations and investment slang, such as "dead cat bounce." I highly recommend this financial dictionary to investors of all levels of experience.
Thursday, February 02, 2006
January Returns For My Model Long-Term Portfolio
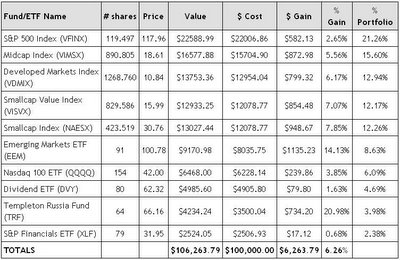
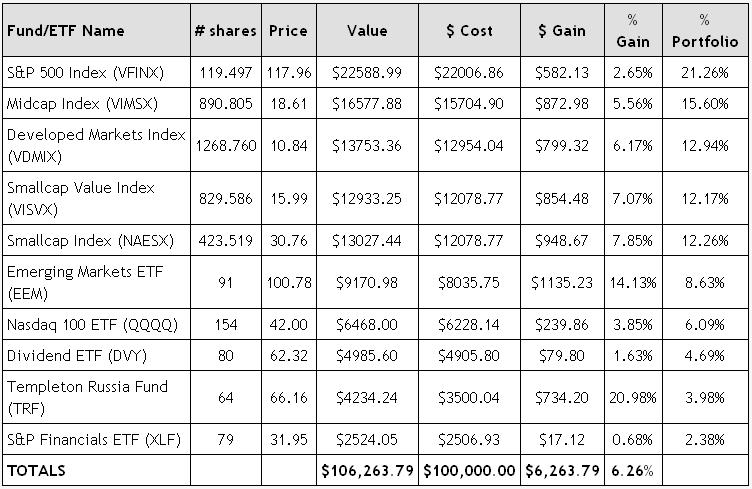
January was a very positive month for my hypothetical model long-term portfolio as shown in the chart below (click on the chart to see a bigger version). During January, the value of the portfolio increased 6.26% from the $100,000 starting value to $106,263,79. As previously discussed, the purchase price for each of the funds/ETFs in the hypothetical model portfolio as the actual December 31, 2005 closing prices of each of these equities minus any applicable trading commissions or other fees.
Small and mid-cap stocks outpeformed their larger counterparts, such as those in the S&P 500. However, the real stars from January 2006 were foreign stocks. Emerging markets did particularly well with EEM returning over 14% and TRF advancing close to 21%.
I think that the market is probably due for a little bit of a pullback, but I do think that 2006 will be a better year for stocks than 2005. With the prices of commodities still increasing, I expect TRF and EEM to continue to outperform this year because both of these equities hold the stocks of many companies that export commodities such as oil.
Small and mid-cap stocks outpeformed their larger counterparts, such as those in the S&P 500. However, the real stars from January 2006 were foreign stocks. Emerging markets did particularly well with EEM returning over 14% and TRF advancing close to 21%.
I think that the market is probably due for a little bit of a pullback, but I do think that 2006 will be a better year for stocks than 2005. With the prices of commodities still increasing, I expect TRF and EEM to continue to outperform this year because both of these equities hold the stocks of many companies that export commodities such as oil.
Wednesday, February 01, 2006
Save Your Pre-1982 Pennies
This post has nothing to do with the stock market, but I think it is interesting nonetheless. Prior to 1982 almost all pennies minted by the U.S. mint contained about 95% copper and 5% tin and zinc.* During mid-1982 the U.S. mint changed the metallic compisition of the pennies to about 99.2% zinc and 0.8% copper. All pennies minted since 1982 have less than 1% copper.
The reason why the composition was changed is because during the early 1980s the price of copper kept rising and the total value of the copper metal in each penny was apporoaching the one cent face value of the penny. Accordingly, if the value of copper had kept rising, the U.S. Mint would have been losing money by producing more of the 95% copper pennies.
As you are probably aware, the prices of commodities have been soaring over the past few years. The price per pound of copper was recently about $2.33. At $2.33 per pound, the value of the copper in most pre-1982 pennies is about 1.45 cents, 45% more than the face value of those pennies, as discussed in this article.
For those who can afford to do so, it might be a good idea to start hoarding any pennies you receive in change that are from before 1982. At some point in the future those pennies might be worth several cents apiece to metal refiners willing to melt them down for the copper contained within them.
At Coinflation.com, you can determine the instrinsic value of various coins in circulation over the past 100 years or so.
*1943 was the exception when steel pennies were minted to conserve copper necessary for in America's WWII efforts.
The reason why the composition was changed is because during the early 1980s the price of copper kept rising and the total value of the copper metal in each penny was apporoaching the one cent face value of the penny. Accordingly, if the value of copper had kept rising, the U.S. Mint would have been losing money by producing more of the 95% copper pennies.
As you are probably aware, the prices of commodities have been soaring over the past few years. The price per pound of copper was recently about $2.33. At $2.33 per pound, the value of the copper in most pre-1982 pennies is about 1.45 cents, 45% more than the face value of those pennies, as discussed in this article.
For those who can afford to do so, it might be a good idea to start hoarding any pennies you receive in change that are from before 1982. At some point in the future those pennies might be worth several cents apiece to metal refiners willing to melt them down for the copper contained within them.
At Coinflation.com, you can determine the instrinsic value of various coins in circulation over the past 100 years or so.
*1943 was the exception when steel pennies were minted to conserve copper necessary for in America's WWII efforts.
Monday, January 30, 2006
Update On Stock Shorting
At the end of December I discussed a hedging strategy for making money of the price disparity between stocks and bonds that I implemented myself on 12/30/05 when I purchased 18 shares of SPY at $124.8388/share and sold short 25 shares of TLT at 91.9068/share.
I closed out my positions on 1/19/06 when I sold my 18 shares of SPY at $128.05/share and bought back 25 shares of TLT at $92.1376 to cover my short position. After accounting for the $5 commissions charged through Ameritrade's Izone brokerage, I initially calculated my gain to be $31.95. However, I checked my account yesterday and discovered that I was also charged a margin fee of $7.70, bringing the total gain down to $24.25.
I was not aware that I would be charged a margin fee, and this does seem to minimize the benefits of this hedging strategy. Apparently when one shorts an equity, the brokerage house adds the proceeds from the short sale in the customer's account, but the funds are typically not available to purchase anything else. Accordingly, to purchase another equity, the customer either has to use other cash already in the account or borrow on the margin from the brokerage house.
I realize these were not large transactions, but I undertook this set of transactions to learn about the fees and other costs involved in shorting equities.
I closed out my positions on 1/19/06 when I sold my 18 shares of SPY at $128.05/share and bought back 25 shares of TLT at $92.1376 to cover my short position. After accounting for the $5 commissions charged through Ameritrade's Izone brokerage, I initially calculated my gain to be $31.95. However, I checked my account yesterday and discovered that I was also charged a margin fee of $7.70, bringing the total gain down to $24.25.
I was not aware that I would be charged a margin fee, and this does seem to minimize the benefits of this hedging strategy. Apparently when one shorts an equity, the brokerage house adds the proceeds from the short sale in the customer's account, but the funds are typically not available to purchase anything else. Accordingly, to purchase another equity, the customer either has to use other cash already in the account or borrow on the margin from the brokerage house.
I realize these were not large transactions, but I undertook this set of transactions to learn about the fees and other costs involved in shorting equities.
My Model Long-Term Portfolio Revisited
I discussed my model long-term all-stocks portfolio in a post written earlier this month. I’ve decided to revisit this portfolio and add monthly updates pertaining to the performance of this hypothetical portfolio.
My assumptions regarding this portfolio are as follows:
(1) $100,000 was invested on December 31, 2005 according to the approximate percentages of the model portfolio listed in my earlier post;
(2) only whole shares may be purchased of any ETFs or closed-end funds;
(3) partial shares may be purchased for any of the mutual funds;
(4) all ETF and closed-end purchases are made through Ameritrade’s Izone service, at a cost of $5 per trade;
(5) all distributions for the mutual funds are reinvested; and
(6) all distributions for the ETFs and closed-end funds are placed in a money-market fund (to simplify the calculations, I will assume that the money-market fund does not pay interest).
Based on the December 31, 2005 closing prices, the following securities were purchased for the model portfolio:
191.497 shares of VFINX at $114.92, a total cost of $22006.84
890.805 shares of VIMSX at $17.63, a total cost of $15704.90
1268.760 shares of VDIMX at $10.21, a total cost of $12954.04
829.586 shares of VISVX at $14.56, a total cost of $12078.77
423.519 shares of NAESX at $28.52, a total cost of $12078.77
91 shares of EEM at $88.25 plus a $5 commission, a total cost of $8035.75
154 shares of QQQQ at $40.41 plus a $5 commission, a total cost of $6228.14
80 shares of DVY at $61.26 plus a $5 commission, a total cost of $4905.80
64 shares of TRF at $54.61 plus a $5 commission, a total cost of $3500.04
79 shares of XLF at $31.67 plus a $5 commission, a total cost of $2506.93
My assumptions regarding this portfolio are as follows:
(1) $100,000 was invested on December 31, 2005 according to the approximate percentages of the model portfolio listed in my earlier post;
(2) only whole shares may be purchased of any ETFs or closed-end funds;
(3) partial shares may be purchased for any of the mutual funds;
(4) all ETF and closed-end purchases are made through Ameritrade’s Izone service, at a cost of $5 per trade;
(5) all distributions for the mutual funds are reinvested; and
(6) all distributions for the ETFs and closed-end funds are placed in a money-market fund (to simplify the calculations, I will assume that the money-market fund does not pay interest).
Based on the December 31, 2005 closing prices, the following securities were purchased for the model portfolio:
191.497 shares of VFINX at $114.92, a total cost of $22006.84
890.805 shares of VIMSX at $17.63, a total cost of $15704.90
1268.760 shares of VDIMX at $10.21, a total cost of $12954.04
829.586 shares of VISVX at $14.56, a total cost of $12078.77
423.519 shares of NAESX at $28.52, a total cost of $12078.77
91 shares of EEM at $88.25 plus a $5 commission, a total cost of $8035.75
154 shares of QQQQ at $40.41 plus a $5 commission, a total cost of $6228.14
80 shares of DVY at $61.26 plus a $5 commission, a total cost of $4905.80
64 shares of TRF at $54.61 plus a $5 commission, a total cost of $3500.04
79 shares of XLF at $31.67 plus a $5 commission, a total cost of $2506.93
Wednesday, January 25, 2006
Nasty Email Exchange Between Money Managers
Althought this is kind of off-topic, I've decided to post the following email nasty email exchange between money managers because I think it is kind of funny. The parties in this exchange are Alan Lewis, a British money manager, and Daniel Loeb, a hedge fund manager in the United States. Apparently the following emails were exchanged after Lewis sent his cv/resume to Loeb:
-----Original Message-----
From: Alan Lewis
Sent: Tuesday, March 22, 2005 11:34 AM
To: Daniel Loeb
Subject: CV
Daniel,
Thanks for calling earlier today. Enclosed is my cv for your review. I look forward to following up with you when you have more time.
Best regards,
Alan
Alan D. Lewis
Managing Director
Sthenos Capital Ltd.
-----Original Message-----
From: Daniel Loeb
Sent: 27 March 2005 23:08
To: Alan Lewis
Subject: RE: CV
what are your 3 best current european ideas?
Daniel Loeb
Managing Member
Third Point LLC
-----Original Message-----
From: Alan Lewis
Sent: Monday, March 28, 2005 1:03 AM
To: Daniel Loeb
Subject: RE: CV
Daniel,
I am sorry but it does not interest me to move forward in this way. If you wish to have a proper discussion about what you are looking to accomplish in Europe, and see how I might fit in, fine.
Lesson one of dealing in Europe, business is not conducted in the same informal manner as in the U.S.
Best regards,
Alan
-----Original Message-----
From: Daniel Loeb
Sent: 28 March 2005 09:50
To: Alan Lewis
Subject: RE: CV
One idea would suffice.
We are an aggressive performance oriented fund looking for blood thirsty competitive individuals who show initiative and drive to make outstanding investments. This is why I have built third point into a $3.0 billion fund with average net returns of 30% net over 10 years.
We find most brits are bit set in their ways and prefer to knock back a pint at the pub and go shooting on weekend rather than work hard. Lifestyle choices and important and knowing one's limitations with respect to dealing in a competitive environment is too. That is Lesson 1 at my shop.
It is good that we learned about this incompatibility early in the process and I wish you all the best in your career in traditional fund management.
Daniel
-----Original Message-----
From: Alan Lewis
Sent: Monday, March 28, 2005 4:08 AM
To: Daniel Loeb
Subject: RE: CV
Daniel,
I guess your reputation is proven correct. I have not been in traditional fund management for more than eleven years. I did not achieve the success I have by knocking back a pint, as you say. I am aggressive, and I do love this business. I am Half American and half French, and having spent more than half my life on this side of the pond I think I know a little something about how one conducts business in the UK and Europe.
There are many opportunities in the UK and Europe, shareholder regard is only beginning to be accepted and understood. However, if you come here and handle it in the same brash way you have in the U.S. I guarantee you will fail. Things are done differently here, yes place in
society still matters, where one went to school etc. It will take tact, and patience (traits you obviously do not have) to succeed in this arena.
Good luck!
Alan
-----Original Message-----
From: Daniel Loeb
Sent: 28 March 2005 10:23
To: Alan Lewis
Subject: RE: CV
Well, you will have plenty of time to discuss your "place in society" with the other fellows at the club.
I love the idea of a French/english unemployed guy whose fund just blew up telling me that I am going to fail.
At Third Point, like the financial markets in general,"one's place in society" does not matter at all. We are a bunch of scrappy guys from diverse backgrounds (Jewish Muslim, Hindu etc) who enjoy outwitting pompous asses like yourself in financial markets globally.
Your "inexplicable insouciance" and disrespect is fascinating; It must be a French/English aristocratic thing. I will be following your "career" with great interest.
I have copied Patrick so that he can introduce you to people who might be a better fit-there must be an insurance company or mutual fund out there for you.
Dan Loeb
Monday, January 23, 2006
Wal-Mart's Stock Valuation Looks Compelling
Take a look at this stock quote and fundamental data for Wal-Mart (symbol: WMT). Click on the image to see a larger version of the fundamental data:

Take a guess as to the date of this fundamental data. Give up? It's from September 1999! Now take a look at this stock quote and fundamental data for WMT from today, January 23, 2006:
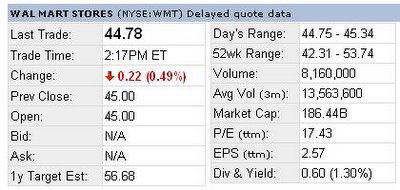
As one can clearly see, WMT is trading for less today than it was nearly 6 1/2 years ago. In case you are wondering, WMT has not split during the past 6 1/2 years. Instead, its valuation relative to its earnings has shrunk substantially as its stock price has basically moved sideways while its earnings have continued to increase at around 15% per year.
Its EPS has risen from about $1.11 per share to about $2.57 per share, decreasing its trailing P/E ratio from close to 40 all the way down to about 17.4 today. Its dividends per share have risen about 18% annually, tripling from 20 cents per share (yield of about 0.45%) to 60 cents per share (yield of about 1.34%). Meanwhile, WMT has been aggressviely buying back shares, decreasing the number of shares outstanding from about 4.46 billion to 4.16 billion.
I personally believe that WMT is long-term "BUY" right now. As one can see in this Value Line report, WMT's trailing P/E ratio is the lowest it has been since at least 1988, and its dividend yield is the highest it has been since at least 1988 (and possibly even earlier - I don't have all of the historical data at my disposal). It's not often that one has the opportunity to purchase shares of a top-notch growing company like Wal-Mart at an historically cheap valuation like this.
I don't mean to imply or suggest that WMT is definitely going to outperform over the next six month or even one year. However, over the long haul it should perform better than the stock market as a whole due to its current attractive valuation and relatively rapidly growing earnings.

Take a guess as to the date of this fundamental data. Give up? It's from September 1999! Now take a look at this stock quote and fundamental data for WMT from today, January 23, 2006:
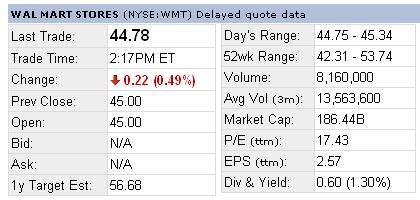
As one can clearly see, WMT is trading for less today than it was nearly 6 1/2 years ago. In case you are wondering, WMT has not split during the past 6 1/2 years. Instead, its valuation relative to its earnings has shrunk substantially as its stock price has basically moved sideways while its earnings have continued to increase at around 15% per year.
Its EPS has risen from about $1.11 per share to about $2.57 per share, decreasing its trailing P/E ratio from close to 40 all the way down to about 17.4 today. Its dividends per share have risen about 18% annually, tripling from 20 cents per share (yield of about 0.45%) to 60 cents per share (yield of about 1.34%). Meanwhile, WMT has been aggressviely buying back shares, decreasing the number of shares outstanding from about 4.46 billion to 4.16 billion.
I personally believe that WMT is long-term "BUY" right now. As one can see in this Value Line report, WMT's trailing P/E ratio is the lowest it has been since at least 1988, and its dividend yield is the highest it has been since at least 1988 (and possibly even earlier - I don't have all of the historical data at my disposal). It's not often that one has the opportunity to purchase shares of a top-notch growing company like Wal-Mart at an historically cheap valuation like this.
I don't mean to imply or suggest that WMT is definitely going to outperform over the next six month or even one year. However, over the long haul it should perform better than the stock market as a whole due to its current attractive valuation and relatively rapidly growing earnings.
Friday, January 20, 2006
The S&P 500 Index is Substantially Undervalued Relative To The 10-Year U.S. Government Bond
It has been my opinion for some time now that the S&P 500 index is substantially undervalued relative to the 10-year U.S. government bond, as I have previously discussed. I now have additional data to support my hypothesis.

The chart shown above (click on it to view an enlarged image of this chart) shows a plot of the trailing earnings yield of the S&P 500 from January 1979 through December 2005. The earnings yield is the inverse of the P/E ratio, i.e., it is the E/P ratio of the S&P 500. The chart also shows a plot of the yield on the 10-year-govt. bond during the same time period. All of the data plotted above is based on the end-of-month closing values of each of these securities every month from 1979 until 2005.
As shown, the 10-year-govt. bond yield was higher than the S&P 500 earnings yield for almost every month during the entire time period. The only times when it is lower is between (a) 1979 and 1980, and (b) between mid-2002 and today. During this time period, the average end-of-month trailing P/E ratio of the S&P 500 was 16.29, giving an earnings yield of 6.14%, and the average 10-year-govt. bond yield was 7.77%. Accordingly, on average, the 10-year-govt. bond yield was 1.64% higher than the earnings yield.
Therefore, one can deduce that when the 10-year-govt. bond yield was more than 1.64% larger than the S&P 500 earnings yield, it was, an average, a sign that the S&P 500 was overvalued relative to the 10-year-bond. Conversely, when the 10-year-govt. bond yield was less than 1.64% larger than the earnings yield, it was, an average, a sign that the S&P 500 was undervalued relative to the 10-year-govt. bond.
Currently, as of December 31, 2005, the S&P 500 trailing P/E ratio was 17.30, giving an earnings yield of 5.78%, and the 10-year-govt. bond yield was 4.39%. Accordingly, the earnings yield of the S&P 500 was 1.39% larger than the 10-year-govt. bond yield.
I view this as a very bullish sign that the S&P 500 is due to rally relative to the 10-year-govt. bond. As discussed above, the S&P 500 earnings yield was, on average, about 1.64% less than the 10-year-govt. bond yield from 1979-2005, but now it is currently 1.39% greater than the govt. bond yield! To correct this anomaly, the S&P 500 would have to undergo a tremendous rally relative to the 10-year-bond.
*In a previous post I discussed the relative valuations of the S&P 500 earnings yield versus the 10-year-govt. bond yield. The earnings yields discussed in the previous post were based on forward earnings estimates for the S&P 500, instead of the actual trailing earnings used above. I had to use the actual earnings for the current discussion because I was plotting historical earnings and did not know what the forward estimates were throughout this time period.

The chart shown above (click on it to view an enlarged image of this chart) shows a plot of the trailing earnings yield of the S&P 500 from January 1979 through December 2005. The earnings yield is the inverse of the P/E ratio, i.e., it is the E/P ratio of the S&P 500. The chart also shows a plot of the yield on the 10-year-govt. bond during the same time period. All of the data plotted above is based on the end-of-month closing values of each of these securities every month from 1979 until 2005.
As shown, the 10-year-govt. bond yield was higher than the S&P 500 earnings yield for almost every month during the entire time period. The only times when it is lower is between (a) 1979 and 1980, and (b) between mid-2002 and today. During this time period, the average end-of-month trailing P/E ratio of the S&P 500 was 16.29, giving an earnings yield of 6.14%, and the average 10-year-govt. bond yield was 7.77%. Accordingly, on average, the 10-year-govt. bond yield was 1.64% higher than the earnings yield.
Therefore, one can deduce that when the 10-year-govt. bond yield was more than 1.64% larger than the S&P 500 earnings yield, it was, an average, a sign that the S&P 500 was overvalued relative to the 10-year-bond. Conversely, when the 10-year-govt. bond yield was less than 1.64% larger than the earnings yield, it was, an average, a sign that the S&P 500 was undervalued relative to the 10-year-govt. bond.
Currently, as of December 31, 2005, the S&P 500 trailing P/E ratio was 17.30, giving an earnings yield of 5.78%, and the 10-year-govt. bond yield was 4.39%. Accordingly, the earnings yield of the S&P 500 was 1.39% larger than the 10-year-govt. bond yield.
I view this as a very bullish sign that the S&P 500 is due to rally relative to the 10-year-govt. bond. As discussed above, the S&P 500 earnings yield was, on average, about 1.64% less than the 10-year-govt. bond yield from 1979-2005, but now it is currently 1.39% greater than the govt. bond yield! To correct this anomaly, the S&P 500 would have to undergo a tremendous rally relative to the 10-year-bond.
*In a previous post I discussed the relative valuations of the S&P 500 earnings yield versus the 10-year-govt. bond yield. The earnings yields discussed in the previous post were based on forward earnings estimates for the S&P 500, instead of the actual trailing earnings used above. I had to use the actual earnings for the current discussion because I was plotting historical earnings and did not know what the forward estimates were throughout this time period.
Tuesday, January 17, 2006
Websites with good historical information on ETFs and Indicies
Over the past few years I've found that that Yahoo! Finance provides a lot of historical information about mutual funds and stocks that is very valuable when deciding whether to invest money in mutual funds or stocks. However, the current and historical information for ETFs listed at Yahoo! Finance is seriously deficient. For example, Yahoo Finance! often fails to list P/E information for ETFs and does not list actual calender year returns for any ETFs.
I did some sleuthing on Google and found the following good resources of ETF information:
(1) ETFConnect.com - this website contains a treasure trove of data for ETFs and closed-end funds, including historical returns, P/E ratios, top holdings, etc.
(2) Amex.com - this website for the American Stock Exchange (the "AMEX") also contains quite a bit of current and historical data for ETFs, including historical returns, P/E ratios, and recent dividend payouts
(3) Barra.com - this website contains historical fundamental data for a variety of S&P and Barra indicies, many of which are tracked by corresponding ETFs. For example, this website includes historical monthly fundamental data, including P/E ratios, for the S&P 500 dating back to 1976.
(4) Index Universe - this website contains lots of historical data for various ETFs and indicies.
I did some sleuthing on Google and found the following good resources of ETF information:
(1) ETFConnect.com - this website contains a treasure trove of data for ETFs and closed-end funds, including historical returns, P/E ratios, top holdings, etc.
(2) Amex.com - this website for the American Stock Exchange (the "AMEX") also contains quite a bit of current and historical data for ETFs, including historical returns, P/E ratios, and recent dividend payouts
(3) Barra.com - this website contains historical fundamental data for a variety of S&P and Barra indicies, many of which are tracked by corresponding ETFs. For example, this website includes historical monthly fundamental data, including P/E ratios, for the S&P 500 dating back to 1976.
(4) Index Universe - this website contains lots of historical data for various ETFs and indicies.
Monday, January 09, 2006
My Model Long-Term Portfolio Allocation
I have come up with a good long-term portfolio allocation that I believe will return somewhere around 11-13% over the long haul while providing solid dividend income. The model portfolio includes 100% stocks (no bonds) and includes both foreign and domestic stocks, as well as several styles of domestic stocks. I have a preference for low-cost mutual funds in my model portfolio so that I can avoid paying commissions when making purchases.
Going forward, I intend to maintain the % allocation listed below. To do so I will take all of the dividends I receive from each investment and invest these dividends in investments that are underweighted at the time. I will also invest all new money I am putting into the market into the underweighted investments.
My model portfolio is as follows:
22.000% VFINX
15.700% VIMSX
12.950% VDMIX
12.075% VISVX
12.075% NAESX
8.050% EEM
6.250% QQQQ
4.900% DVY
3.500% TRF
2.500% XLF
VFINX is the Vanguard Index 500 mutual fund that tracks the S&P 500 index. I chose this index for the model portfolio because it is primarily a diversified large cap domestic index of both value and growth stocks. VFINX is the largest S&P 500 index mutual fund and currently has a low expense ratio of about 0.18%. Once I have $100,000 invested in VFINX, I will contact Vanguard and have them switch my shares over to their Admiral class, which has a lower expense ratio of around 0.09%.
VIMSX is the Vanguard Midcap Index mutual fund. It tracks the MSCI US Mid Cap 450 Index, a broadly diversified index of the stocks of medium-size U.S. companies. Midcap stocks have historically returned about 1% more annually than large company stocks, but they are also more volatile. VIMSX has one of the lowest expense ratios around (about 0.22%) for a midcap index fund.
VDMIX is the Vanguard Developed Markets Index mutual fund. It tracks the performance of the MSCI EAFE index. As I wrote in a previous post, the MSCI EAFE index is the "S&P 500 index" of foreign stocks. With the current U.S. trade deficit being as large as it currently is, I believe that foreign stocks will almost certainly return more than U.S. stocks over the next 30 years or so as the global trade imbalances eventually correct themselves. VDIMX has one of the lowest expense ratios around (about 0.19%) for any foreign stock index fund.
VISVX is the Vanguard Small Cap Value Index mutual fund. It tracks the performance of a benchmark index that measures the investment return of small-capitalization value stocks. As I have previous written, small cap value stocks perform extremely well over the long haul, even though they can be volatile over short periods of time. Small cap value stocks also provide decent dividend income which can somewhat ensure that such companies don't waste their cash on foolish investments because the dividend payments must be paid out to shareholders. VIMSX has one of the lowest expense ratios around (about 0.23%) for any small cap value index fund.
NAESX is the Vanguard Small Cap Value Index mutual fund. It tracks the performance of the MSCI US Small Cap 1750 Index, a broadly diversified index of the stocks of smaller U.S. companies. NAESX has one of the lowest expense ratios around (about 0.23%) for any diversified small cap index fund.
EEM is the iShares Emerging Market Index ETF. Vanguard has an Emerging Markets Index mutual fund, but Vanguard charges an outrageous load of .5% whenever a purchase or sale is made. That is why I prefer this iShares ETF. EEM tracks the MSCI Emerging Markets Free Index, an index of stocks in various emerging markets such as India, China, Russia, Brazil, Mexico, Taiwan, South Korea, and South Africa. Emerging markets can be extremely rewarding (EEM is up around 200% since April 2003), but they are also very volatile.
QQQQ is the Nasdaq 100 ETF which tracks the Nasdaq 100, an index of the 100 largest non-financial stocks traded on the NASDAQ stock market. It is heavily weighted with technology stocks and is extremely volatile. However, over the long haul it should provide a higher return than the S&P 500.
DVY is the iShares Dow Jones U.S. Select Dividend Index Fund, an index of stocks exhibiting positive dividend-per-share growth rates over the past five years and dividend payout ratios below 60%. DVY currently has a dividend yield of around 3%.
TRF is the Templeton Russia & East European Fund, a closed end fund that invests in companies in the emerging markets of Russia and Eastern Europe. Russia and Eastern Europe are supposed to expand their economies much faster than the U.S. over the next 30 years and should be a good place to invest. As I have previously written, I chose to invest in TRF because there is no good ETF investing directly in this region.
XLF is the SPDR Financial components, i.e., an ETF of the financial stocks in the S&P 500 index. XLF provides good dividend income and has a relatively low expense ratio (~0.26%).
Going forward, I intend to maintain the % allocation listed below. To do so I will take all of the dividends I receive from each investment and invest these dividends in investments that are underweighted at the time. I will also invest all new money I am putting into the market into the underweighted investments.
My model portfolio is as follows:
22.000% VFINX
15.700% VIMSX
12.950% VDMIX
12.075% VISVX
12.075% NAESX
8.050% EEM
6.250% QQQQ
4.900% DVY
3.500% TRF
2.500% XLF
VFINX is the Vanguard Index 500 mutual fund that tracks the S&P 500 index. I chose this index for the model portfolio because it is primarily a diversified large cap domestic index of both value and growth stocks. VFINX is the largest S&P 500 index mutual fund and currently has a low expense ratio of about 0.18%. Once I have $100,000 invested in VFINX, I will contact Vanguard and have them switch my shares over to their Admiral class, which has a lower expense ratio of around 0.09%.
VIMSX is the Vanguard Midcap Index mutual fund. It tracks the MSCI US Mid Cap 450 Index, a broadly diversified index of the stocks of medium-size U.S. companies. Midcap stocks have historically returned about 1% more annually than large company stocks, but they are also more volatile. VIMSX has one of the lowest expense ratios around (about 0.22%) for a midcap index fund.
VDMIX is the Vanguard Developed Markets Index mutual fund. It tracks the performance of the MSCI EAFE index. As I wrote in a previous post, the MSCI EAFE index is the "S&P 500 index" of foreign stocks. With the current U.S. trade deficit being as large as it currently is, I believe that foreign stocks will almost certainly return more than U.S. stocks over the next 30 years or so as the global trade imbalances eventually correct themselves. VDIMX has one of the lowest expense ratios around (about 0.19%) for any foreign stock index fund.
VISVX is the Vanguard Small Cap Value Index mutual fund. It tracks the performance of a benchmark index that measures the investment return of small-capitalization value stocks. As I have previous written, small cap value stocks perform extremely well over the long haul, even though they can be volatile over short periods of time. Small cap value stocks also provide decent dividend income which can somewhat ensure that such companies don't waste their cash on foolish investments because the dividend payments must be paid out to shareholders. VIMSX has one of the lowest expense ratios around (about 0.23%) for any small cap value index fund.
NAESX is the Vanguard Small Cap Value Index mutual fund. It tracks the performance of the MSCI US Small Cap 1750 Index, a broadly diversified index of the stocks of smaller U.S. companies. NAESX has one of the lowest expense ratios around (about 0.23%) for any diversified small cap index fund.
EEM is the iShares Emerging Market Index ETF. Vanguard has an Emerging Markets Index mutual fund, but Vanguard charges an outrageous load of .5% whenever a purchase or sale is made. That is why I prefer this iShares ETF. EEM tracks the MSCI Emerging Markets Free Index, an index of stocks in various emerging markets such as India, China, Russia, Brazil, Mexico, Taiwan, South Korea, and South Africa. Emerging markets can be extremely rewarding (EEM is up around 200% since April 2003), but they are also very volatile.
QQQQ is the Nasdaq 100 ETF which tracks the Nasdaq 100, an index of the 100 largest non-financial stocks traded on the NASDAQ stock market. It is heavily weighted with technology stocks and is extremely volatile. However, over the long haul it should provide a higher return than the S&P 500.
DVY is the iShares Dow Jones U.S. Select Dividend Index Fund, an index of stocks exhibiting positive dividend-per-share growth rates over the past five years and dividend payout ratios below 60%. DVY currently has a dividend yield of around 3%.
TRF is the Templeton Russia & East European Fund, a closed end fund that invests in companies in the emerging markets of Russia and Eastern Europe. Russia and Eastern Europe are supposed to expand their economies much faster than the U.S. over the next 30 years and should be a good place to invest. As I have previously written, I chose to invest in TRF because there is no good ETF investing directly in this region.
XLF is the SPDR Financial components, i.e., an ETF of the financial stocks in the S&P 500 index. XLF provides good dividend income and has a relatively low expense ratio (~0.26%).
Monday, January 02, 2006
Strategy for Making Money Off The Price Disparity Between Stocks and Bonds
Back in November I wrote an article for this blog about the FED Model. In that article I mentioned that the P/E ratio of the S&P 500 was about 15.72 back then, resulting in an earnings yield (i.e., the inverse of the P/E ratio) of about 6.36%. The yield on the 10-year bond, on the other hand, was about 4.564%, resulting in an historically high risk premium (i.e., the difference between the earnings yield and the 10-year bond yield) of about 1.796%.
I checked the Standard & Poor's website today to see if the earnings estimates had changed since November. According to Standard & Poor's, the 2006 earnings projections on the S&P 500 have been slightly reduced to $76.80. As of the December 30, 2005 market closing, the S&P 500 was trading at 1248. Accordingly, the earnings yield on the S&P 500 is now about 6.154% (i.e., 1248/$76.80). Meanwhile, the 10-year bond yield has fallen to 4.395%, resulting in a risk premium of about 1.795%.
Risk premiums of well over 1% are historically very large. The average risk premium between 1994 and 2003 was about 0.11%. Accordingly, there is a strong likelihood that the current risk premium will eventually shrink to a much lower level.
To profit off this current price discrepancy between bonds and stocks and the inevitable shrinking of this risk premium, I recommend selling short shares of the iShares Lehman 20+ Year Treasury Bond ETF (symbol: TLT), and using the proceeds from the short sale to purchase shares of the S&P 500 Depository Receipts ETF (symbol: SPY).
I implemented this strategy myself on Friday, December 30th. Specifically, I sold short 25 shares of TLT at $91.9068/share and established a long position of 18 shares of SPY at $124.8388. My commissions were $5 on each transaction through my Ameritrade Izone account.
After shorting the shares of TLT, I received $2292.67 net of commissions. Including commissions, it cost a total of $2252.10 to purchase the shares of SPY. After these trades, my account looks like this:
-25 shares of TLT
+18 shares of SPY
$40.57 leftover cash from the short sale
I will post monthly updates to let everyone know how well this long-short hedge is performing.
I checked the Standard & Poor's website today to see if the earnings estimates had changed since November. According to Standard & Poor's, the 2006 earnings projections on the S&P 500 have been slightly reduced to $76.80. As of the December 30, 2005 market closing, the S&P 500 was trading at 1248. Accordingly, the earnings yield on the S&P 500 is now about 6.154% (i.e., 1248/$76.80). Meanwhile, the 10-year bond yield has fallen to 4.395%, resulting in a risk premium of about 1.795%.
Risk premiums of well over 1% are historically very large. The average risk premium between 1994 and 2003 was about 0.11%. Accordingly, there is a strong likelihood that the current risk premium will eventually shrink to a much lower level.
To profit off this current price discrepancy between bonds and stocks and the inevitable shrinking of this risk premium, I recommend selling short shares of the iShares Lehman 20+ Year Treasury Bond ETF (symbol: TLT), and using the proceeds from the short sale to purchase shares of the S&P 500 Depository Receipts ETF (symbol: SPY).
I implemented this strategy myself on Friday, December 30th. Specifically, I sold short 25 shares of TLT at $91.9068/share and established a long position of 18 shares of SPY at $124.8388. My commissions were $5 on each transaction through my Ameritrade Izone account.
After shorting the shares of TLT, I received $2292.67 net of commissions. Including commissions, it cost a total of $2252.10 to purchase the shares of SPY. After these trades, my account looks like this:
-25 shares of TLT
+18 shares of SPY
$40.57 leftover cash from the short sale
I will post monthly updates to let everyone know how well this long-short hedge is performing.
Subscribe to:
Posts (Atom)