Friday, June 16, 2006

The Volatility of the Russian Stock Market

The Russian stock market has taken it on the chin over the past six weeks or so. For example, the Russia RTX stock index (see the chart below) has fallen from an intra-day high of 2955 on May 10 to a close of 2105 as of today. That is a drop of 28.7%!

However, the index is still up substantially over the past 52 weeks. It closed at 1057 on June 16, 2005. That is a gain of 1048 points, or 99%. It amazes me that the stock market index for country as big as Russia can be this volatile.

I personally will continue to invest in Russia stocks via the Templeton Russia and Eastern European fund (symbol: TRF). However, I will continue to limit TRF to no more than about 3% of my long-term portfolio.

Monday, June 05, 2006

May Returns For My Model Long-Term Portfolio

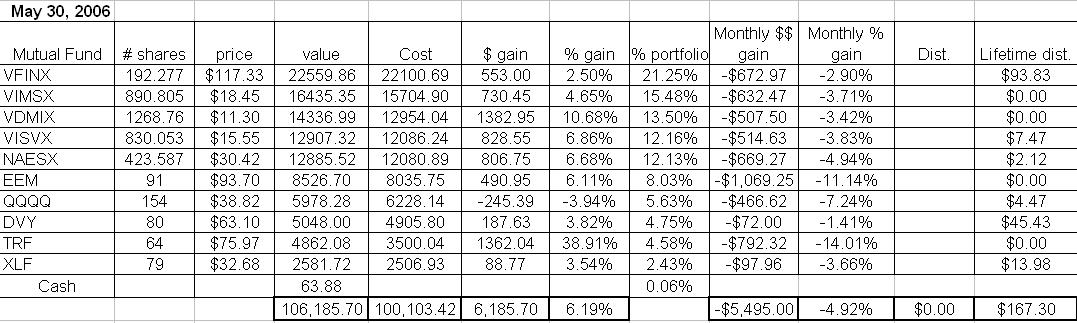
My Hypothetical Model Portfolio performed very poorly in May. As of the market close on May 30, 2006, the Hypothetical Model Portfolio* dropped $5,495, or 4.92% during May. However, the Hypothetical Model Portfolio is still up $6185.70 in 2006, a gain of 6.19%, as shown on the table below (click for a larger image of the table).

Every one of the holdings went down, as May was a horrible month for stock market investors across the board. Foreign holdings were my worst performers in April, with the Templeton Russia closed-end fund (TRF) plummeting 14.01% and the Emerging Markets ETF (EEM) dropping 11.14%. Despite these huge drops, TRF and EEM are still up 38.91% and 6.11%, respectively, in 2006. My two best performers were the iShares Dow Jones U.S. Select Dividend Index Fund (DVY) and Vanguard S&P 500 index fund (VFINX) which dropped 1.41% and 2.90%, respectively.

I suspect that the ugly May results do not represent anything other than a correction. The U.S. economy is still humming along and the FED will probably stop raising rates sometime soon. The Hypothetical Model Portfolio is still on pace for a solid 15.5% total return in 2006 even after the May correction.

*The Hypothetical Model Portfolio was hypothetically created with an investment of $100,000 with investments made as of the closing values on December 30, 2005. The reason why the total cost in the chart is greater than $100,000 is because the total cost accounts for the value of dividends reinvested into the mutual funds in the portfolio.

Wednesday, May 31, 2006

Franklin Templeton Posts The Premium/Discount For The Templeton Russia Fund (TRF) On Its Website

Want to find out the premium (or rare discount) for the Templeton Russia and Eastern Europe fund (symbol: TRF)? Franklin Templeton posts the current premium on its website every few days or so. I just checked and as of May 26, 2006, the premium for TRF was a whopping 33.22%! It's concerning that the premium is that high, as a sharp pullback in the Russian stock market could send TRF plummeting.

Friday, May 26, 2006

Emigrant Direct Raises Its Money Market Interest Rate to 4.65%

I just saw an online advertisment for Emigrant Direct which indicates that they have raised their money market interest rate to 4.65%. As far as I can tell, this rate change was implemented today. Emigrant Direct now pays half a percent more than INGDirect, which currently pays a paltry 4.15%.

Tuesday, May 23, 2006

BusinessWeek Has An Article About The Recent Sharp Pullback In Emerging Markets

BusinessWeek has published an article entitled "Behind Emerging Markets' Malaise" on their website about the sharp pullback over the past two weeks in the Emerging Markets sector. BusinessWeek interviewed Alka Banerjee, who focuses on international markets as vice-president of global index management at Standard & Poor's. Banerjee seems to be of the opinion that this is just a temporary, but necessary, pullback in the Emerging Markets and that Emerging Markets will continue to do well unless the price of oil collapses.

Monday, May 15, 2006

The NAV Premium For The Templeton Russia Fund (TRF) is Plummeting!

The Templeton Russia and Eastern Europe closed-end fund (symbol: TRF) has dropped like a rock over the past week. TRF has dropped from a closing price of $93.81 on May 9th to a closing price of $72.50 as of today, May 15th. That is a drop of 22.7% in just four days of trading. Meanwhile, the Russia stock market benchmark RTX index has dropped around 9% over the same time period.

The reason why TRF has fallen so much more than the RTX index is because its closed-end fund premium was very high as of last week. According to ETFconnect, TRF was trading at a premium of about 37% above its net asset value (NAV) on May 9th, and that premium has dropped all the way down to about 9% as of today, May 15th.

Most closed-end funds trade at discounts to their underlying NAV. However, some of the best performers do occassionally trade at large premiums. Unfortunately, these premiums can quickly evaporate when the going gets tough and momentum investors start to jump ship.

Wednesday, May 10, 2006

Everbank Provides An Easy Way To Speculate In Foreign Currency And Precious Metals

I just discovered Everbank, a bank that allows investors to easily invest in foreign currency and precious metals. They offer CDs and deposit accounts in foreign currencies that will appreciate in value if the U.S. dollar depreciates. Everbank also offers a "DollarBull" CD that will increase in value if the U.S. dollar rises against selected foreign currencies.

One of their most interesting offerings is their "MarketSafe" Gold Bullion CD. This is a great offer because if gold rises over the five year holding period, the investor will get back the original principal plus the value of the increase in the price of gold. But the investor is also protected if gold falls in price and will still get back the original principal in the event of a decline in the price of gold.

Friday, May 05, 2006

Moneychimp.com Has An Interesting Article About Small Cap Stocks

I recently discovered an interesting article about small cap stocks and their returns relative to large cap stocks over at Moneychimp.com. The article also includes an online calculator that allows one to enter a range of years between 1927 and 2005 and view the annualized returns for small cap and large cap growth and value stocks. The calculator also showns nominal and inflation-adjusted returns. As I have previously written, small cap value stocks trounce large cap growth stocks over time and this article provides further evidence of the disparity in returns.

Thursday, May 04, 2006

Free Online Access To The Wall Street Journal's Website, WSJ.com, Through May 10

I just discovered that the Wall Street Journal is providing free access to its online website, WSJ.com, through May 10th. I wish I had discovered this promotion a few days ago because apparently they have been providing free access since Monday, May 1st. The Wall Street Journal is, in my opinion, the best financial-related newspaper in the U.S. and I highly recommend that everyone check out the WSJ.com website.

Sunday, April 30, 2006

April Returns For My Model Long-Term Portfolio

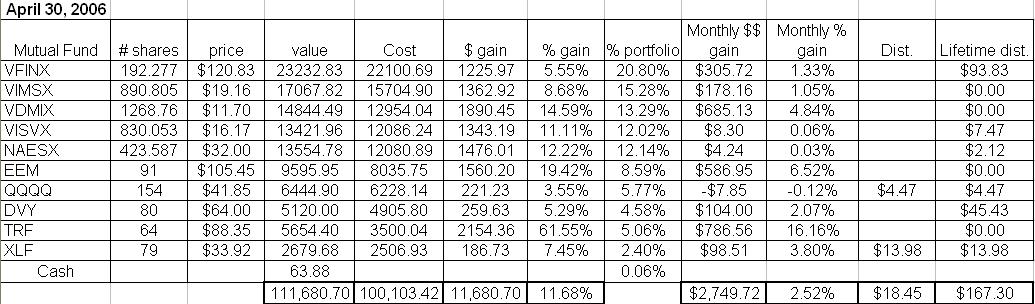
My Hypothetical Model Portfolio had another solid month in April. As of the market close on April 28, 2006, the Hypothetical Model Portfolio* was up $2,749.72, or 2.52% during March. The Hypothetical Model Portfolio is now up $11680 in 2006, a gain of 11.68%, as shown on the table below (click for a larger image of the table).

Foreign holdings were my top performers in April, with the Templeton Russia closed-end fund (TRF) leading the way with a strong 16.16% return. The Emerging Markets ETF (EEM) was the second-best performer with a 6.52% return, and the Vanguard Developed Markets index fund (VDMIX) came in third place with a return of 4.84%. Through the first four months of 2006, TRF is already up a whopping 61.55%, EEM is up 19.42%, and VDMIX is up 14.59%! I expect foreign equities to continue to perform well given that the U.S. Dollar is bound to fall relative to foreign currencies due to the United States’ massive trade deficit. Also, TRF and EEM are invested heavily in countries that are huge net exporters of oil and raw materials and will continue to benefit from the current commodities boom.

Other solid April performers include the SPDR Financial components (XLF) which returned 3.80% and the iShares Dow Jones U.S. Select Dividend Index ETF fund which returned 2.07%. Both of these invest heavily in financial stocks. These probably did well in April after the FED indicated it is close to halting its interest rate hikes.

Vanguard Index 500 mutual fund (VFINX) and the Vanguard Midcap Index mutual fund (VIMSX) were up just over 1% in April, and the small cap holdings (i.e., Vanguard Small Cap Index mutual fund (NAESX) and Vanguard Small Cap Value Index (VISVX)) were barely changed in April. The only holding that fell in value was the Nasdaq 100 ETF (QQQQ), which fell about .12%.

Two of the holdings in my Hypothetical Model Portfolio paid dividends in March. As I mentioned in a previous post, the dividends from mutual fund holdings are reinvested, but the dividends from ETFs or a closed end fund (i.e., TRF) are not reinvested- they will accumulate as "CASH" on the performance table below. The reason I am doing this is because the index mutual funds in this portfolio do not charge a transaction fee for reinvesting dividends. To reinvent dividends for any of the ETFs or TRF, on the other hand, would cause me to incur transaction fees for the trading commissions.

XLF paid a dividend of $0.177 on April 28 (a total of $13.98), and QQQQ paid a dividend of $0.029 on April 28 (a total of $4.47), both of which were moved to "CASH" on the table shown below.

*The Hypothetical Model Portfolio was hypothetically created with an investment of $100,000 with investments made as of the closing values on December 30, 2005. The reason why the total cost in the chart is greater than $100,000 is because the total cost accounts for the value of dividends reinvested into the mutual funds in the portfolio.

Friday, April 28, 2006

The iShares Silver ETF Was Launched Today

The first silver-based ETF was launched today by Barclays Global Investors. The name of the ETF is the iShares Silver Trust and its ticker symbol is SLV. Each share of SLV will initially represent 10 ounces of silver and opened at $129/share on the AMEX today. For almost all investors, SLV provides the cheapest means of buying and selling silver.

TheStreet.Com article about SLV

Thursday, April 27, 2006

Some ETFs Are Very Difficult To Sell Short Due To A Shortage Of Available Shares

Smartmoney.com has an interesting article about shorting ETFs. The focus of the article is that despite the ETF industry's claims that one of the major benefits of ETFs is their ability to be sold short, many brokers are unable to actually sell shares of some of the ETFs short due to a shortage of available shares.

As I mentioned in a previous post, to sell shares short, one's broker has to borrow the shares from some other party who has a long position on the shares (usually another broker). Unfortunately, if no shares are available for borrowing, then it is not be possible to sell short any shares. This is disconcerting because on of the strategies I intend to implement in the future is a long-short arbitrage strategy (I have already tested such a strategy, as discussed here and here) where I sell short shares of a first ETF and use the proceeds of the short sale to purchase a long posiiton of a second, and different, ETF I think will outperform the first ETF.

Monday, April 24, 2006

Stock Market Styles Are Very Cyclical

NYC Money has a good article posted on her blog regarding large caps and why the financial industry keeps promoting them. She postulates that the financial industry including writers for financial media really have no idea how to make money in the stock market and so they thereofre just keep repeating the same "advice" everyone else has been giving.

I agree with what she wrote and some of the comments posted there. If money managers and financial writers really wanted investors to achieve the highest returns over the long haul, they would tell them to invest in value and small caps, placing a large amount in small cap value stocks. If one had invested $10,000 in small cap value stocks in 1926 and held them and re-invested the dividends, that investment would have been worth about $1 billion by the end of 2004, as discussed in a previous post I wrote about small-cap outperformance.

She mentioned she doing well in foreign equities and I admit that I myself have been investing in foreign stocks over the past year and have done well. However, if there's one thing I've learned by following the markets and investing for the last 10+ years it is that the stock market tends to be very cyclical. Investing styles tend to do in and out of favor. For most of the 90s, large caps (especially large cap growth) performed very well and may have provided better returns than small caps or foreign stocks. Small caps and mid caps have substantially outperformed large caps since 2000. The tide will eventually turn again, although I don't really know when that will be.

Foreign stocks and emerging markets performed very poorly in the late 80s and during most of the 90s. The problem with a lot of the emerging markets is that the political situations in those countries are frequently unstable. Investors in emerging markets took a bath, for example, (a) in the mid-90s when Mexico's currency collapsed, (b) in the late 90s when the Asian currency crises occurred and Russia devalued its currency, and (c) in or around 2001 when Argentina defaulted on billions of dollars in international loans and its currency collapsed.

The stock markets of foreign developed markets (e.g., in high GDP countries such as Japan or Western Europe) also tended to trail the large cap US stocks in the 90s due to the Japanese stock market crash, although they have certainly provided better returns than U.S. large caps over the past 6 years.

I think that a well-diversified portfolio, such as my Hypothetical Long-Term Portfolio, should include large caps, mid caps, small caps, and foreign developed and emerging markets stocks. In a previous post I posted a useful chart that illustrates the annual returns for various investment styles between 1986 and 2005.

Thursday, April 20, 2006

The Silver Market Is In A Free-Fall Today

I just checked the price of silver and was shocked to see that it fell over 14% today, from $14.53 per ounce all the way down to $12.41 per ounce. Presumably, speculators are locking in gains from silver's YTD 63% gain as of yesterday. I don't know what will happen to silver in the short-term, but it would not surprise me to see its ascent continue later in 2006. The silver market kind of reminds me of the Nasdaq in the late 90s when the Nasdaq Composite Index experienced tremendous volatility and shot up in value to levels that could not be justified by the underlying fundamentals.

Thursday, April 13, 2006

Website For Performing Historical U.S. Dollar Value Comparisons

I have discovered a great website entitled "Economic History Services" that allows one to see just how much the value of the U.S. dollar has eroded over time. You can input a dollar value between 1790 and 2004 and out how much it was worth in a different year. Several methods are used to determine the relative valuation, including CPI, GDP deflator, Unskilled wage, GDP per capital, and (relative share of) GDP.