Thursday, March 30, 2006

Great Article About Dividends At Morningstar.com

Yesterday I was persuing the Yahoo Finance website when I saw a great article about dividends and why they have come back into favor and will become increasingly important in the future.

I highly recommend reading the following article, entitled "Ride the Retiree Wave with Dividends":

It's no secret what's about to crash onto the shores of the American economy. Rather than working for money, the massive baby boom generation expects to have its hard-earned money work for it.

At the same time, another megatrend is rolling through corporate America. Despite all-time record profits, big business isn't investing in new factories, stores, and workers the way it usually does--and the cash is piling up.

If this sounds like a dream scenario for dividend investors, well, it just might be real. We're certainly focusing on these trends in Morningstar DividendInvestor, which I edit. (Click here for more information, including a risk-free trial subscription.) But we can't just buy any dividend-paying stock and expect the newly retired to run it up; a lot of traditional income sectors like real estate investment trusts and utilities are already expensive. If we're going to ride the wave from here, we need an unconventional strategy:

1) Buy dividend potential, not just current yield
2) Look for unconventional sources of income

. . .

Tuesday, March 28, 2006

Investing In Growth Stocks Is Not For The Faint Of Heart

It seems like everyday we are inundated with stories about the next hot growth stocks. For example, people like Jim Cramer have made careers pontificating about the next high-flying stocks and the hottest industries in which to invest. Wall Street loves growth stocks when they are appreciating. For example, the stock market bubble of the late 90s was primarily due to the appreciation of growth stocks. The bubble was highly concentrated among large company growth stocks in general and technology growth stocks in particular.

I don't doubt that there was a lot of money to be made in growth stocks during the late 90s. However, when the actual growth of the underlying companies slows (which it inevitably will), the growth stocks take a beating. Take Cisco (CSCO), the technology bellwether, for example. In the late 90s there were several years when CSCO's PE ratio exceeded 100! After the bubble burst, however, CSCO's earnings took a hit and CSCO's stock price fell from the upper 70s in April 2000 all the way down to about 8 by October 2002. Its stock price has since recovered to about 21 and its forward PE ratio is about 18 right now. However, it stock price experienced an extreme PE compression once the growth ended in the late 90s and its stockholders have taken a bath even though earnings are much higher now than they ever were during the bubble.

This is precisely why investing in high PE growth stocks is so risky - they often continue their upward ascent until the day arrives when an earning target is missed or earnings growth slows. It is not atypical for these stocks to then lose 20+% almost immediately as the market digests the news. The moral is - if you are going to invest in growth stocks be prepared for volatility and be ready to sell if the market really turns on them.

Tuesday, March 21, 2006

Robert Kiyosaki Is A Blowhard

I'm sure that just about everyone has heard of Robert Kiyosaki by now. Kiyosaki is the author of the bestselling "Rich Dad, Poor Dad" series of books. These books all contain a plethora of financial advice and can be quite entertaining. However, Kiyosaki's shtick does become tiresome after awhile. I think that he would be more bearable if I actually believed the stories in his book that he claims to have experienced actually happened.

Through his books, he discusses the contrasting financial advice given to him while he was growing up both by his actual father (his "poor" dad, a well-educated but not financially successful man) and by his next-door playmate's father (his "rich" dad, a high school dropout who was very successful). According to Kiyosaki, he once asked his father how to make money when he was a young boy. His father said he had not made much money and did not know how to make it. He suggested that Robert ask the father of his next-door playmate, who became his "rich dad." Kiyosaki supposedly developed a father-son relationship with the neighbor.

That's a great story. It's too bad none of it is true. Kiyosaki fails to ever mention the name of the alleged "rich dad" in any of his books and newspaper reporters in Hawaii, where Kiyosaki grew up, have been unable to locate the identity of this man. John T. Reed, a real estate guru, has an interesting website that exposed Kiyosaki as a fraud. It would be fine with me if Kiyosaki simply referred to his "rich dad" as a straw man in his books. However, the fact that Kiyosaki insists that this man is real destroys his own credibility.

Kiyosaki also writes a semi-monthly column for Yahoo Finance. In his columns he typically mentions how the U.S. dollar has serious problems going forward and that he bought up lots of oil and gold in the late 90s when everyone else was purchasing technology stocks. I, along with a large portion of Wall Street, happen to agree that the U.S. dollar has some serious problems going forward. However, I don't remember hearing him tell everyone to dump technology stocks, buy commodities, or short the dollar back in the late 90s. If what he says is true, he should provide some documented proof of such. Otherwise, he looks like the type of know-it-all blowhard we've all met who lies about his investment returns to make himself appear smarter than he really is.

Friday, March 17, 2006

Think Twice Before Investing In Companies That Manufacture Memory Devices Or Other Electronic "Commodities"

SanDisk (symbol: SNDK), the market leader in the manufacture of flash memory market, has performed very well over the past year or so. Since July 2005, SNDK has risen from the low 20s to the mid-50s today. One of my friends was recently touting this stock to me and telling me I should pick up some shares. However, I had to caution him. Although I have no doubt that SanDisk is a good company and has been performing well recently, I am of the opinion that an investment in a memory manufacturer must be made only after careful consideration because the stock performance of such companies has been historically extremely volatile.

Another of my college friends invested in Micron Technology (symbol: MU), another big memory manufacturer, back in 1995 after it had fallen from a high of about $90 to a price of about $60 (these prices do not account for the 2:1 split that took place in 2000). My college friend was convinced that this was just a temporary dip that provided a good investing opportunity. My college friend, however, could not have been more wrong. Within months, the bottom fell out for MU as it steadily fell, eventually down past $20. The stock eventually recovered toward the end of 1996 and he sold at about $30, taking a 50% loss on his position.

What neither my current friend nor my college friend fully appreciated is that the business outlook for memory manufacturers can dramatically change in the blink of an eye. There are many different companies that manufacture memory and as far as consumers are concerned, the products of all of these companies are pretty much the same. In other words, there really isn't much brand loyalty (there is, of course, some degree of loyalty, but not much) among consumers when it comes to the purchase of memory products. As such, I consider memory products to be a kind of electronic "commodity." That is, as far as consumers are concerned, there's no major difference between the products manufactured by any of the memory manufactures - consumers primarily will purchase memory products based on price alone.

Therefore, it is extremely difficult and almost impossible to maintain a sustainable competitive advantage over any competitor companies in this field. As a consequence, if one of the memory manufacturers decides to cut prices in order to gain market share, all of the other players are forced to cut their prices as well. These inevitable price wars absolutely kill profit margins.

The point of this post is not to belittle people for investing in memory manufacturers. I have no doubt that there's a lot of money to made in them from time to time - if you look at the historical stock charts for SNDK and MU, you'll see some terrific periods of time where these stocks went up hundreds of percentage points during a short time span. However, there are also some horrible stretches where the bottom fell out of the stock prices. I don't claim to be an expert investor - I've certainly made my own mistakes as well. Although I've never directly invested in a memory manufacturer, I have invested in stocks in the disk drive sector, which experiences analogous problems. I owned shares of Applied Magnetics, a disk drive component manufacturer, back in the late 1990s and lost my complete position when it went bankrupt.

So the moral is that you should perform extra diligence before investing in any memory manufacturer (or any company that produces an electronic commodity).

Thursday, March 16, 2006

The Nasdaq 100 ETF Can Now Be Purchased Without Paying A Commission

Nasdaq Global Funds has instituted an investment program entited "QQQDirect" which allows individual investors to directly purchase shares of the Nasdaq 100 index tracking ETF, QQQQ. To sign up for this program, go to this website: http://qqqdirect.com/. According to the Nasdaq Global Funds, participants will be able to purchase shares of QQQQ once a month without having to pay any commissions. The minimum monthly investment is $10, and additional purchases will be either $3.99 or less if the participant signs up for a pre-selected investment program. The great thing about this is that there are no account setup, minimum balance, or inactivity fees. The main applicable fee is a $12.99 commission to be paid when the participant sells shares through the plan.

I think this is a great program for small investors who want to invest in QQQQ via dollar-cost averaging. Hopefully the S&P 500 (symbol: SPY) or S&P Midcap (symbol: MDY) ETFs will follow suit with similar plans.

Friday, March 10, 2006

The 6-Year Anniversary of the Nasdaq Composite's All-Time High Close

On March 10, 2000, the Nasdaq composite index closed at an all-time high of 5048.62. Shortly thereafter, the stock market bubble burst, dropping the Nasdaq composite down to an intra-day low of 1108.49 on October 10, 2002, a drop of about 78% in just over two years. In the subsequent rally through today's close of 2262.04, the Nasdaq composite index has risen about 104% from its 2002 low. However, it still remains about 55% below its all-time high closing value.

CNN.com has a nice article about the 6-year anniversary of the Nasdaq composite's all-time high close.

Wednesday, March 08, 2006

The Templeton Russia & East European Fund Closed-End Fund Has Been Dropping Like A Rock

As I have previously mentioned, Russia is projected to be one of the fastest growing economies over the next several decades. According to a 2003 Goldman Sachs report, Russia's economy is projected to grow much faster than the U.S.'s from now until 2050, and its currency exchange rate is projected to strengthen by 200+%. Russia therefore presents an exciting investing opportunity and assuming Russia maintains a stable political system, should be an excellent market in which to invest over the next several decades. However, the Russian stock market is not for the faint of heart. The Templeton Russia & East European Fund Closed-End Fund (TRF), one of the best-performing funds investing solely in Russia, has dropped from $79.12 at Monday's market close down to $69.99 as of today's market close, a drop of 11.5% in just two days! However, the fund is still up 28.1% so far in 2006. Despite its overall impressive returns, the volatility can be somewhat unsettling.

Monday, March 06, 2006

About Me

For those of you who are interested, I work in the legal profession and have been following and investing in the stock market for over 10 years. I invest almost half of my after-tax income in the stock market every month. I do have some money in individual stocks, but am currently concentrating on building up my long-term portfolio. FYI, my long-term portfolio is the same as the hypothetical portfolio I have been tracking this year. However, unlike the hypothetical portfolio, I do not yet currently own shares of each of the 10 holdings of the long-term portfolio. Instead, to keep my trading commissions at a minimum, I have been purchasing shares of one additional holding in my long-term portfolio each month in an effort to match the percentage holdings my model portfolio dictates.

The reason why I invest this way is because I used to invest primarily in the S&P 500 when I had the deluded belief that I was "buying the market" and that this was the safest way to invest. Accordingly, my portfolio is substantially overweighted with shares of the S&P 500 index. (I also started purchasing shares of Vanguard's Midcap fund several years ago and am also overweighted in that fund. However, that's not such a bad thing, as the Midcap index has performed very well since 2003.)

Given the passage of time since the bubble burst in 2000, I have definitely learned some powerful lessons about the markets. I now appreciate how cyclical different styles of stocks can be, regardless of the underlying fundamentals of the representative companies. For example, the S&P 500 index is primarily a large cap index and has been pretty much flat for the past 5 years even though the earnings of the S&P 500 constituent companies have increased by somewhere around 60+%.

It seems to me that any reasonable portfolio should include midcap and small cap (especially small cap value) index funds, as they outperform their larger peers over time. Also, I now realize that given the massive U.S. trade deficit, it is a good idea to own foreign stocks, because they should outperform when the U.S. dollar inevitably weakens against foreign currencies.

I also have some additional money that I occasionally invest in individual stocks. When investing in individual stocks, I am very selective and will invest in only one or two (or maybe three) stocks at a time, but I like to make big bets. I get my ideas from the Value Line, an invaluable resource. I tend to invest in retailers and semiconductors when I do invest in individual stocks. Instead of trying to invest in the next "hot" sector, I tend to follow these same sectors (i.e., retailing and semiconductors) and buy when good stocks in those industries are being dumped. I realize that other people can do very well by investing in hot industries, but I think I personally perform my best by concentrating my bets of just a couple industries while following those industries closely, learning all that I can.

Tuesday, February 28, 2006

February Returns For My Model Long-Term Portfolio

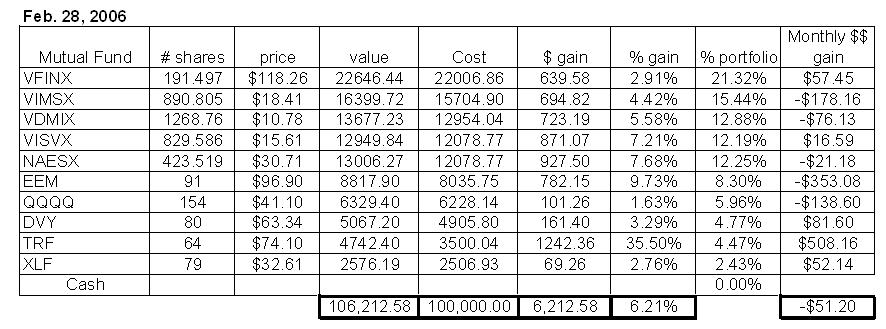
February was a somewhat volatile month for my hypothetical model long-term portfolio. The portfolio was in the red for most of the month, pushing into postive territory during the last full week of February, and then dipped back down on the last day of the month, the 28th, closing down $51.20 for February. However, after the impressive January returns, the portfolio is still up $6212 for 2006, a gain of 6.21%.

The returns are shown in the chart below (click for a bigger image). As shown, the TRF (the Templeton Russia closed-end fund) was my top performer, followed by DVY (the dividend ETF), XLF (the S&P 500 Financials ETF), and VFINX (the Vanguard S&P 500 fund). The worst performers, on the other hand, were EEM (the iShares Emerging Markets ETF), VIMSX (the Vanguard mid-cap index fund), and QQQQ (the Nasdaq 100 ETF). My portfolio did ok because of the strength of the Russia stock market and of the large-cap stocks that dominate DVY, XLF, and VFINX. Perhaps we are finally witnessing the start of the long-awaited outperformance of large-cap relative to small-cap stocks. I guess we'll have to wait and see what happens in March...

Wednesday, February 22, 2006

S&P 500 Dividends

I was looking at the Standard & Poor's website today when I discovered a file posted there containing historical dividend information for the S&P 500 dating back to 1988. I have entered this historical dividend information into the chart below. As shown, the dividends paid by the S&P 500 component companies increased from $9.73 in 1988 to $22.22 in 2005. That works out to an average annual increase of 4.978% in the dividend yield. That's impressive, especially considering that this time period includes the horrible bear market from 2000 to 2002 when the S&P 500 lost around 50% of its value.

As shown below, the annual % increase of dividends has been increasing very rapidly since 2002. That is undoubtedly due to the strong corporate profits and the dividend tax decrease that Congress passed in 2003. According to Standard & Poor's, the dividends are projected to increase to $24.50 for 2006, a 10.26% increase over 2005.

I anticipate large % increases in the dividend rate in the coming years. With the favorable tax treatment and Baby Boomers nearing retirement age, the Boomers are going to want extra dividend income and will pressure companies to keep raising dividends. This is definitely a plus for investors. The great thing about dividends is that they provide investors with a return without forcing the investors to sell at inopportune moments to realize these returns.


***An updated version of this chart containing data from 1977-2014 may be found in this post.

Tuesday, February 21, 2006

February 2006 Update - The S&P 500 Index Is Still Undervalued

I wrote a post last November in which I argued that the S&P 500 was undervalued. Since then, the S&P 500 has risen 5.16%, from about 1220 to 1283. This is a pretty good gain, but I think that the S&P 500 has further to go. Relative to bonds, the S&P 500 is still undervalued and due for more gains.

According to Standard & Poor's, the projected reported earnings through 12/31/06 for the sum of the components of the S&P 500 is about $79.30/share. As discussed above, the S&P 500 index currently trades at about 1283. Accordingly, the forward P/E ratio of the S&P 500 index is about 16.18 (1283/$79.30). This is slightly higher than the historical P/E ratio of around 14-15. However, bonds are much more richly valued than their historical averages. Moreover, other asset classes such as real estate and commodities are also richly valued right now. It therefore seems inevitable that stocks will eventually catch up to the performance of these other asset classes.

Stocks have been weighed down over the past year in large part due to high energy prices and a FED that has been steadily raising short-term interest rates. However, consumer price inflation is still relatively low and bonds are expensive. The yield on the 10-yr US bond is currently about 4.56%. The earnings yield on the S&P 500 based on estimated 2006 earnings is about 6.18% (i.e., the inverse of the 16.18 P/E ratio). Therefore the earnings yield on the S&P 500 is about 1.62% higher than the 10-yr bond yield. This is large disparity and is certain to shrink over the next few years as the S&P 500 outperforms the 10-yr bond.

I believe that 2006 will continue to be a good year for the S&P 500. The S&P 500 probably won't increase in value every month, but even after accounting for a pullback or two this should be a good year nevertheless.

Great new real estate website

Many of the people out there who have substantial or rapidly growing stock portfolios probably also own real estate. I personally bought my first property last year. In my opinion, one of the important things to do before making a bid on a home is to do a little research on the prices for which comparable homes have been selling.

As luck would have it, a fantistic new real estate website was released recently. I found out about it a week ago and have used it several times. The name of the website is Zillow.com, and it provides estimates of a home's value as well as esitmates of nearby comparable homes. It also lists the square footage of homes, the most recent property tax bills, and the date and amount of the most recent sale (if within the past 5 or 10 years). There are also maps and charts of the average value of the home over the previous 5-10 years and the average value of all homes in the same zip code over the same time period.

I highly recommend Zillow.com to anyone looking to purchase a home anytime soon.

Monday, February 13, 2006

Home Depot Is a “Strong Buy”

I’ve been following the stock price of Home Depot (symbol: HD) on-and-off for about the past 10 years. There was a time in the late 90s when HD had a PE ratio in the 50s and traded as high as 70 back in April 2000. However, the investing world's view of large company growth stocks in general, and HD in particular, has radically changed over the past 6 years or so.

Take a look at this chart of fundamental data for HD from 1999-2005:


19992000
2001200220032004
2005
Sales per share
16.6819.6822.83
25.4027.3133.8637.95
"Cash flow" per share
1.21
1.37
1.62
1.99
2.27
2.93
3.45
Earnings per share
1.00
1.10
1.29
1.56
1.882.26
2.68
Dividends per share
.11
.16
.17
.21
.26
.33.40
Book Value per share
5.36
6.46
7.71
8.64
9.44
11.1912.40
Common shares outstanding (millions)
2304.3
2323.7
2345.9
2293.0
2373.0
2158.72135.0

As one can see, HD's sales, cash flow, earnings per share, dividends, and book value have all risen substantially since 1999. Meanwhile, the number of shares outstanding has fallen due to an aggressive stock buyback plan.

A 168% increase in earnings per share since 1999 is astounding! The dividends almost quadrupled during the same time period. The dividend payouts are also increasing at an accelerated rate - HD annouced in January that it is upped its dividend payout by 50% in 2006, to 60 cents per share.

HD's stock price has not gone anywhere since the late 90s, despite the impressive improvement in HD's fundamentals during this time period. Money often flows in and out of certain sectors and styles of stocks from time-to-time. During the mid-late 90s, small company stocks were out of favor as investors focused on large company growth stocks. However, the tide shifted in 2000 and small company growth stocks have generally been favored over large company growth stocks for the past 6 years. However, this trend will eventually reverse itself as it always does.

Wall Street can only ignore HD for so long. Its PE ratio is as low as its been since at least the mid 80s, as one can see in this report from the Value Line. Based on 2006 estimated earnings of $3 per share, HD currently has a rock-bottom forward PE ratio of about 13. It would not surprise me to see its forward PE ratio expand to about 20 over a period of 12-18 months. I do not know when the money will flow back into HD, but it seems inevitable that investors will return. When they do, look for HD to rocket.

Tuesday, February 07, 2006

Updated "Periodic Table" of Equity Style Investment Returns Through 2005

Posted below is an updated version of the "Periodic Table" of equity style investment returns from 1986-2005. (Click on the image below to see a larger version of the Periodic Table.) This chart was originally posted on the website for Callan Associates.


*** I have written a new post with results from 1989-2008.

The Morgan Stanley India Investment Fund

Back in early December I wrote a post about how closed end funds are the best way for small investors to invest in certain foreign markets such as Russia and India, countries for which no country-specific ETFs currently exist. I currently own the Templeton Russia closed-end fund (symbol: TRF) in my own personal account as well as in my hypothetical model portfolio. As I mentioned last week, TRF has performed extremely well for me and is already up around 20% so far in 2006.

I recently decided to see how the Morgan Stanley India Investment closed-end fund (symbol: IIF) has been doing and am amazed at how how well it has been performing. According to ETF connect, as of January 31, 2006 IIF has returned 86.69% for the past year, 76.76% annually over the past 3 years, 39.51% annually over the past 5 years and 22.08% annually over the past 10 years! $1000 invested in IIF 10 years ago would have grown to about $7350. Those returns are phenomenal. I wonder how well IIF will do over the next 10 years...