Showing posts with label dividends. Show all posts

Friday, December 09, 2022

Historical Dividends for Altria (1979-2022)

Altria (ticker symbol: MO) is one of the most popular dividend stocks among dividend growth investors. Altria owns Phillip Morris USA, which sells Marlboro, the most popular cigarette brand in the world in terms of sales.  Altria controls about 48.8% of the cigarette market in the United States and sells various cigarette brands such as Parliament, Virginia Slims, and Basic brands in addition to the Marlboro brand.

Altria was formerly known as Phillip Morris Companies, Inc. prior to a re-branding that occurred in 2003.  Altria has engaged in two corporate spin-offs in recent years.  In 2007 Kraft Foods was spun off from Altria (now know as Kraft Heinz with ticker symbol KHC), and in 2008 Phillip Morris International (ticker symbol: PM) was spun off. 

I last wrote about Altria back in 2012 and am providing my first follow-up on the popular dividend stock since then.  Altria's stock price has struggled since July 2017 when it topped out at about $74/share.  At the time, Altria had a trailing price/earnings (PE) ratio of around 22 or 23 and an annual dividend payout of $2.44/share.  At that price and that dividend payout, Altria's dividend yield was approximately 3.30%.

According to Value Line, Altria is projected to earn approximately $4.85/share for the 2022 calendar year.  Altria closed at $46.71 on December 9, 2022.  Assuming that Altria really does earn $4.85/share, then its current trailing PE is about 9.63, about 56% lower than it was at the stock's peak in July 2017.  Altria currently pays an annual dividend of $3.76/share.  At the most recent closing price for Altria, its dividend yield is about 8.04%, about 143% higher than the dividend yield was in July 2017.

The crazy thing is that even though Altria's earnings per share increased 43% from about $3.39/share in 2017 to a projected $4.85/share in 2022 and the dividend per share increased 54% from $2.44/share to $3.76/share, the share price has decreased about 37% from $74 in July 2017 to $46.71 today.

There are several reasons for Altria's share price decline in the past several years.  One reason was the investment of $13 billion in JUUL in 2018, an investment which may end up being a total loss for Altria.  Altira also invested $1.8 billion in Canadian cannabis company, Cronos, in 2019, an investment which is also almost certainly underwater at the present time.  There has also been a decline in smoking rates among adults in the U.S. from about 20.9% in 2005 to about 12.5% as of 2020. 

Nevertheless, despite a somewhat cloudy and unpredictable future, Altria is still very profitable and is at one of its lowest valuations since the late 1990s.  I personally believe that a decade from now, Altria share price will be significantly higher than it is today and ordinary investors will wonder how this stock ever traded at such a low valuation relative to earnings per share and annual dividend payouts.

The charts shown below (click on each chart for a larger view) show annual dividend payments for Altria between 1979 and 2022.  These charts also show increases in the annual dividend payments over various 5- and 10-year periods of time.  As shown, the 5-year annualized dividend increase has ranged between a low of about 7.70% (for the period ending in 2022) and a high of about 25.36% (for the period ending in 1990).   The 10-year annualized dividend increase has ranged between a low of about 8.03% (for the period ending in 2022) and a high of about 23.12% (for the period ending in 1989). 


* Without Kraft Foods included in its results, Altria would have paid a dividend of  $2.88 in 2007.
** Without Phillip Morris International included in its results, Altria would have paid a dividend of $1.22 in 2008., 
*** These charts start with data from the calendar year 1979 because I was unable to locate reliable annual dividend payouts for the years prior to 1979.


Tuesday, July 04, 2017

S&P 500 Dividends (1977-2016)

The chart shown below (click on the chart to see a larger image) annual dividend payouts for the S&P 500 Index between 1977 and 2016. As shown, the dividends paid by the S&P 500 Index component companies increased from $4.67 in 1977 to about $45.70 in 2016. This is a total increase of about 879% and an annualized increase of 6.02% in the annual dividend payout. This an impressive annualized increase considering that this time period includes several bear markets such as those during (a) 1981-82; (b) 1990-91; (c) 2000-02; and (d) 2008-09.  The last two bear markets were particularly bad, as the SP 500 Index lost more than 50% of its value during each. 

As shown, the annual dividend payout amounts increased very rapidly during the late 70s-early 80s likely as a result of inflationary pressures (during the 1970s) and strong economic growth (during the 1980s).  The annual % increase in dividends was also strong between 2003 and 2007, fueled both by strong corporate profits and the dividend tax cut that Congress passed in 2003.  The annual dividend payout of the S&P 500 Index has increased substantially since the end of the Financial Crisis and was about 103.93% higher during 2016 than it was during 2009. 

There will likely be further % increases in the dividend rate in the coming years. Given that investors were burned badly during the 2000-2002 and 2007-08 bear markets , and generally prefer dividend increases over share buybacks.  The Federal Reserve recently announced that all major U.S. banks passed requisite financial stress tests and approved plans to allow those banks to use capital to  allocate extra capital for stock buybacks, dividends and other purposes.  Accordingly, there is a strong likelihood that financial components of the S&P 500 Index will substantially increase dividends in the near future.


Sunday, February 01, 2015

S&P 500 Dividends (1977-2014)

The chart shown below (click on the chart to see a larger image) illustrates annual dividend payouts for the S&P 500 Index between 1977 and 2014. As shown, the dividends paid by the S&P 500 Index component companies increased from $4.67 in 1977 to about $39.44 in 2013. This is a total increase of about 744% and an annualized increase of 5.94% in the dividend yield. This a solid annualized increase considering that this time period includes several bear markets such as those during (a) 1981-82; (b) 1990-91; (c) 2000-02; and (d) 2008-09.  During the last two bear markets, the SP 500 Index lost more than 50% of its value. 

As shown, the annual dividend payout amounts increased very rapidly during the late 70s-early 80s likely as a result of inflationary pressures (during the 1970s) and strong economic growth (during the 1980s).  The annual % increase in dividends was also strong between 2003 and 2007, fueled both by strong corporate profits and the dividend tax cut that Congress passed in 2003.  The annual dividend payout of the S&P 500 Index increased by double digits during each of the past four years and was about 73.59% higher in 2014 than it was in 2010. 

I continue to anticipate further % increases in the dividend rate in the coming years. Investors were burned badly during the 2000-2002 and 2007-08 bear markets and currently appear to prefer dividend increases over share buybacks. Moreover, as a result of the recent bouts of increased volatility, dividend-paying stocks are viewed favorably by investors who like receiving periodic dividend payments.


***An updated version of this chart containing data from 1977-2016 may be found in this post.

Friday, February 21, 2014

S&P 500 Dividends (1977-2013)

The chart shown below (click on the chart to see a larger image)  illustrates annual dividend payouts for the S&P 500 Index between 1977 and 2013. As shown, the dividends paid by the S&P 500 Index component companies increased from $4.67 in 1977 to about $34.99 in 2013. This is a total increase of about 649% and an annualized increase of 5.75% in the dividend yield. This an impressive annualized increase considering that this time period includes several sharp bear markets such as those during (a) 1981-82; (b) 1990-91; (c) 2000-02; and (d) 2008-09.  During the last two bear markets, the S&P 500 Index lost more than 50% of its value. 

As shown, the annual dividend payout amounts increased very rapidly during the late 70s-early 80s likely as a result of inflationary pressures (during the 1970s) and strong economic growth (during the 1980s).  The annual % increase in dividends was also strong between 2003 and 2007, fueled both by strong corporate profits and the dividend tax cut that Congress passed in 2003.  Dividend payouts, however, plummeted over 21% in 2008 during the 2008 bear market and financial crisis and only recovered to hit a new all-time high in 2012.  The annual dividend payout of the S&P 500 Index increased by double digits during each of the past three years and was about 53.9% higher in 2013 than it was in 2010. 

I still anticipate further % increases in the dividend rate in the coming years. Investors were burned badly during the 2000-2002 and 2007-08 bear markets and currently appear to prefer dividend increases over share buybacks. However, the % increase may be smaller in future years, given the dividend tax increases that the Obama administration pushed through Congress in 2012.


***An updated version of this chart containing data from 1977-2016 may be found in this post.

Sunday, May 26, 2013

Historical Dividends for General Electric (1962-2012)

General Electric (ticker symbol: GE) is a large multinational conglomerate corporation and is one of the original 12 components of the Dow Jones Industrial Average.  General Electric owns businesses in four different segments: Energy, Technology Infrastructure, Capital Finance, and Consumer & Industrial

General Electric stock is the most widely held stocks in the entire world.  General Electric is also a favorite equity holding among investors seeking dividend income.  As of the market close on May 24, 2013, General Electric's dividend yield was about 3.23%.  General Electric has paid a dividend every quarter for over 100 years.

The charts below (click on a chart for a larger view) illustrate annual dividends for General Electric stock between 1962 and 2012.  As shown, the dividend per share rose from a split-adjusted value of $0.0208/share in 1962 to $0.70/share in 2012.  That is a total gain of 3,260% during that 50-year period of time, or an annualized gain of 7.28%.  This annualized gain greatly exceeds the annualized inflation rate of about 4.12% during the same time period.

This annualized gain is particularly impressive when considering that the dividend payout either stayed the same or increased for every year except for 2009, when the dividend payout was slashed, dropping the payout in 2010 to $0.46/share from a high of $1.24 in 2008.

General Electric is a solid blue chip company which will likely continue to increase its dividends for the foreseeable future.  It took the extreme financial crisis of 2008 to cause General Electric to cut its dividend in 2009, an event which is unlikely to occur again anytime soon.


Saturday, February 16, 2013

S&P 500 Dividends (1977-2012)

The chart shown below (click on the chart to see a larger image) illustrates dividend information for the S&P 500 Index from 1977-2012. As shown, the dividends paid by the S&P 500 Index component companies increased from $4.67 in 1977 to about $31.25 in 2012. That works out to a total increase of about 569.08% and an annualized increase of 5.581% in the dividend yield. This is a particularly impressive annual increase considering that this time period includes several bear markets such as those during (a) 1981-82; (b) 1990-91; (c) 2000-02; and (d) 2008-09.  The last two bear markets were particularly painful as the S&P 500 Index lost more than 50% of its value during both. 

As shown in the chart below, the annual % increase in dividends increased very rapidly during the late 70s-early 80s as a result of inflationary pressures (during the 1970s) and strong economic growth (during the 1980s).  The annual % increase in dividends was also strong between 2003 and 2007, fueled both by strong corporate profits and the dividend tax cut that Congress passed in 2003.  Dividend payouts, however, plummeted over 21% in 2008 during the 2008 bear market and financial crisis and only recovered to hit a new all-time high last year, in 2012.

I anticipate further % increases in the dividend rate in the coming years. Investors were burned badly during the 2000-2002 and 2007-08 bear markets and currently seem to prefer dividend increases over share buybacks. However, the % increase may be smaller in future years, given the dividend tax increases that the Obama administration pushed through Congress in 2012. 


***An updated version of this chart containing data from 1977-2016 may be found in this post.

Saturday, November 24, 2012

Historical Dividends for Altria (1979-2012)

Altria (ticker symbol: MO) is one of the most well-known corporations in the world.  Altria owns Phillip Morris USA, which sells Marlboro, the most popular cigarette brand in the world in terms of sales.  Altria controls about 50% of the cigarette market in the United States and sells various cigarette brands such as Parliament, Virginia Slims, and Basic brands in addition to the Marlboro brand.

Altria was formerly known as Phillip Morris Companies, Inc. prior to a re-branding that occurred in 2003.  Altria has engaged in two corporate spin-offs in recent years.  In 2007 Kraft Foods (ticker symbol: KRFT) was spun off from Altria and in 2008 Phillip Morris International (ticker symbol: PM)was spun off. 

Altria is a favorite equity holding among investors seeking dividend income.  As of the market close on November 23, 2012, Altria's dividend yield was about 5.26% and the company has historically maintained one of the largest dividend yields among equities in the Standard & Poor's 500 Index.  According to Altria's website, the company's target dividend payout ratio is approximately 80 percent of adjusted earnings per share.  After accounting for stock splits and the spin-offs of Kraft Foods and Phillip Morris International, Altria has increased its dividend payout per share every year since at least 1970.

The cigarette industry is a mature one that has loyal (or addicted) costumers.  State and local governments have raised taxes on cigarettes on a seemingly annual basis, yet the sales of cigarettes and other tobacco products continue to increase annual given the relatively inelastic demand for such tobacco products.

As a result of the maturity of the market, the relatively inelastic demand, and the large target dividend payout ratio of 80% of adjusted earnings per share, Altria has provided an unbelievable total return to stock holders over the years, making many long-term holders multimillionaires.  Between January 1970 and November 2012, Altria's total return (accounting for reinvestment of dividends and the spin-offs of Kraft Foods and Phillip Morris International) was approximately 216,200%, and annualized gain of about 20% per year!  A $10,000 investment in 1970 in Altria would have grown to approximately $21,620,000 by November 2012, an astonishing return over that time period.

Not surprisingly, the growth in Altria's annual dividend payouts has also been incredibly impressive.  The chart below shows the annual dividends for Altria paid between 1979 and the estimate 2012 full year distribution.*  As shown, after accounting for share splits and the spin offs of Kraft Foods and Phillip Morris International, Altria paid a dividend of approximately $0.0521/share in 1979 and the dividend has increased to an estimate $1.70 in 2012.  The annual dividend has therefore increased 10,421% during this time period.  The annual dividend dividend has increased at an annualized rate of over 15% per year since 1979.

The chart shown below (click on the chart for a larger view) also lists increases in the dividend payout over various 5- and 10-year periods of time.  As shown, the 5-year annualized dividend increase has ranged between a low of about 8.03% (for the period ending in 2007) and a high of about 25.36% (for the period ending in 1990).   The 10-year annualized dividend increase has ranged between a low of about 8.42% (for the period ending in 2007) and a high of about 23.12% (for the period ending in 1989).

Altria has been a staple of investors hungry for large and reliable ever-increasing dividend payouts and should continue to be so for years to come.  There have been fears that fewer people would taking up smoking given the effort to educate young people about the dangers of tobacco use and the always-looming treat of lawsuits.  However, Altria has nevertheless continued to provide strong returns in recent years.  Anyone looking for dividend income should consider Altria as well as Phillip Morris International, which may have a brighter future given the projected steady increase in the number of smokers overseas.


* Without Kraft Foods included in its results, Altria would have paid a dividend of  $2.88 in 2007.
** Without Phillip Morris International included in its results, Altria would have paid a dividend of $1.22 in 2008., 
*** This chart starts with data from the calendar year 1979 because I was unable to locate reliable annual dividend payouts for the years prior to 1979. 

Tuesday, September 11, 2012

S&P 500 Dividends (1988-2011)

The chart shown below (click on the chart to see a larger image) illustrates dividend information for the S&P 500 Index from 1988-2011. As shown, the dividends paid by the S&P 500 component companies increased from $9.73 in 1988 to $26.43 in 2011. That works out to a total increase of 171.63% and an average annual increase of 4.440% in the dividend yield. This is relatively impressive annual increase considering that this time period includes the terrible bear markets during (a) 2000 to 2002; and (b) 2008, during each of which the S&P 500 lost about 50% of its value.

As shown in the chart below, the annual % increase of dividends increased very rapidly between 2003 and 2007, fueled both by strong corporate profits over the past few years and the dividend tax cut that Congress passed in 2003.  The dividends plummeted over 21% in 2008 during the 2008 bear market and financial crisis and has since nearly recovered to the 2007 high.

I anticipate further % increases in the dividend rate in the coming years. Investors were burned badly during the 2000-2002 and 2008 bear markets and currently seem to prefer dividend increases over share buybacks.

***An updated version of this chart containing data from 1977-2016 may be found in this post.

Saturday, March 08, 2008

S&P 500 Dividends (Updated through 2007)

In February 2006 and January 2007 I wrote posts about dividends for the S&P 500 Index. I've decided it is time to update the chart to include dividend information for the full 2007 year. The dividend information is available at the Standard & Poor's website.

The chart shown below (click on the chart to see a larger image) illustrates dividend information for the S&P 500 from 1988-2007. As shown, the dividends paid by the S&P 500 component companies increased from $9.73 in 1988 to $27.73 in 2007. That works out to a total increase of 184.99% and an average annual increase of 5.667% in the dividend yield. This is an impressive annual increase considering that this time period includes the terrible bear market from 2000 to 2002 when the S&P 500 lost about 50% of its value.

As shown in the chart below, the annual % increase of dividends has been increasing very rapidly since 2002. This rapid increase has been fueled both by strong corporate profits over the past few years and the dividend tax cut that Congress passed in 2003. According to Standard & Poor's, the dividends are projected to increase to $30.30 for 2008, a 9.268% increase over 2007, although the 2008 estimate might be not be attainable given the weakening U.S. economic conditions.

I anticipate further % increases in the dividend rate in the coming years. As I mentioned in my 2006 post on S&P 500 dividends, companies are going to continue to be pressured to continue raising dividends due to the combination of favorable tax treatment and the fact that Baby Boomers are nearing retirement age and are going to want extra dividend income and will pressure companies to keep raising dividends. However, if a Democrat wins the November 2008 U.S. Presidential election, I expect the favorable tax treatment of dividends to end and dividend tax rates to rise substantially. Accordingly, the era of rapid % dividend increases may be coming to an end.


***An updated version of this chart containing data from 1977-2016 may be found in this post.

Sunday, January 21, 2007

S&P 500 Dividends (Updated through January 2007)

In February 2006 I wrote a post about S&P 500 dividends. I've decided it is time to update the chart to include dividend information for the full 2006 year. The dividend information is available at the Standard & Poor's website.

The chart shown below (click on the chart to see a larger image) illustrates dividend information for the S&P 500 from 1988-2006. As shown, the dividends paid by the S&P 500 component companies increased from $9.73 in 1988 to $24.88 in 2005. That works out to a total increase of 155.7% and an average annual increase of 5.354% in the dividend yield. Considering that this time period includes the horrible bear market from 2000 to 2002 when the S&P 500 lost about 50% of its value, I would say that the annual increase is impressive.

As shown in the chart below, the annual % increase of dividends has been increasing very rapidly since 2002. That is due both to the strong corporate profits over the past few years and the dividend tax decrease that Congress passed in 2003. According to Standard & Poor's, the dividends are projected to increase to $27.35 for 2007, a 9.928% increase over 2006.

I still anticipate large % increases in the dividend rate in the coming years. As I mentioned in my 2006 post on S&P 500 dividends, companies are going to continue to be pressured to continue raising dividends due to the combination of favorable tax treatment and the fact that Baby Boomers are nearing retirement age and are going to want extra dividend income and will pressure companies to keep raising dividends. The great benefit of dividends is that they provide investors with a return without forcing the investors to sell at inopportune moments to realize these returns.


***An updated version of this chart containing data from 1977-2014 may be found in this post.

Friday, September 22, 2006

The SPDR Financial components (XLF) Is Paying A Quarterly Dividend On October 31, 2006

The SPDR Financial components (symbol: XLF) is paying a quarterly dividend of $0.1938 per share on October 31, 2006. It is often difficult to find much information about upcoming dividends for XLF. However, I was able to discover the relevant information by viewing the ETF information available at Amex.com.

Thursday, August 31, 2006

Historical Dividends for the S&P 500

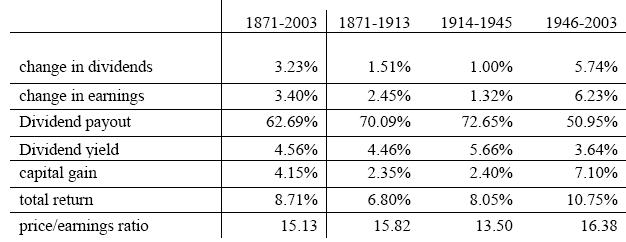
Dividends are crucial to any long-term investor's portfolio. During extended bear markets they often provide the only positive returns to the investor. I have often wondered about the long-term historical dividend increases of various stock indices, such as the S&P 500 index, but have had difficulty finding information going back more than 20 years or so. Luckily, however, I discovered an article concerning historical dividend growth and stock valuations between 1871 and 2003. This article is entitled "Dividends and Stock Valuation: A Study From the Nineteenth to the Twenty-First Century".

This article provides various data which it purports to relate to dividends and valuations for the S&P 500 dating back to 1871.* As shown in the chart below, dividends increased an average of 3.23% per year between 1871 and 2003. However, this average increase was not uniform. The chart below divides the dividend increases into three periods: (a) 1871-1913, (b) 1914-1945, and (c) 1946-2003. Between 1871 and 1913, dividends increased an average of 1.51% annually, between 1914 and 1945 they increased about 1.00% annually, and between 1946 and 2003 they increased an average of 5.74% annually. The dividend increases have accelerated further since 2003, as discussed in a previous post.

The annual dividend increases since 1946 have been very impressive. This highlights the reason why I am a strong believer that dividend-paying stocks should comprise a portion of every investor's portfolio. In fact, I believe that dividend-paying stocks are far more attractive than bonds for young investors (e.g., investors under 35 or 40 who will likely participate in the workforce for 20+ more years) for several reasons.

First, dividend income is generally taxable at a maximum rate of 15% a year as opposed to bond payouts which are generally taxed as ordinary income (i.e., at a tax rate of up to 35% for an individual). Second, dividend-paying stocks offer a great potential for capital gains not provided by bonds. For example, in the event that the earnings for the companies paying dividends keep increasing, there is a likelihood that their associated stock prices will also rise and that their dividend payouts will increase accordingly. Bonds, on the other hand, pay the same interest payout amounts year-after-year.

Finally, dividend-paying stocks provide some protection against inflation that bonds necessarily cannot provide. The prevailing view holds that as inflation heats up companies raise prices and the revenue from the inflated prices is reflected as increased company earnings. As earnings increase, the corresponding stock prices and dividends generally increase accordingly, as discussed above. However, during such inflationary periods, bonds become less valuable. For example, a 5% payout may be attractive when inflation is running at 1% per year, but are far less attractive when inflation accelerates to 6% per year.


*This data cannot be correct, however, as the S&P 500 index was only created in or around 1923. I presume that the data prior to 1923 must have come from a similar index of large-cap stocks.

Tuesday, June 27, 2006

The Nasdaq 100 ETF (QQQQ) Is Paying A Quarterly Dividend On July 31, 2006

The Nasdaq 100 ETF (symbol: QQQQ) is paying a dividend of $0.0257 per share on July 31, 2006. This dividend is being paid to shareholders of record as of June 20, 2006.

As with QQQQ's previous distribution in April 2006, it took me awhile to find the actual distribution date of this dividend. Yahoo Finance had indicated that the dividend was declared on June 16, 2006, but it did not list when the payout date would be. I was finally able to determine the payout date after some searching on Google and finding this article.

Sunday, April 02, 2006

The Nasdaq 100 ETF (QQQQ) Is Paying A Quarterly Dividend On April 28, 2006

The Nasdaq 100 ETF (symbol: QQQQ) is paying a dividend of $0.0291 per share on April 28, 2006. This dividend is being paid to shareholders of record as of March 21, 2006.

It took me awhile to find the actual distribution date of this dividend. Yahoo Finance had indicated that the dividend was declared on Marh 17, 2006, but it did not list when the payout date would be. I was finally able to determine the payout date after some searching on google and finding this article.

Thursday, March 30, 2006

Great Article About Dividends At Morningstar.com

Yesterday I was persuing the Yahoo Finance website when I saw a great article about dividends and why they have come back into favor and will become increasingly important in the future.

I highly recommend reading the following article, entitled "Ride the Retiree Wave with Dividends":

It's no secret what's about to crash onto the shores of the American economy. Rather than working for money, the massive baby boom generation expects to have its hard-earned money work for it.

At the same time, another megatrend is rolling through corporate America. Despite all-time record profits, big business isn't investing in new factories, stores, and workers the way it usually does--and the cash is piling up.

If this sounds like a dream scenario for dividend investors, well, it just might be real. We're certainly focusing on these trends in Morningstar DividendInvestor, which I edit. (Click here for more information, including a risk-free trial subscription.) But we can't just buy any dividend-paying stock and expect the newly retired to run it up; a lot of traditional income sectors like real estate investment trusts and utilities are already expensive. If we're going to ride the wave from here, we need an unconventional strategy:

1) Buy dividend potential, not just current yield
2) Look for unconventional sources of income

. . .

Wednesday, February 22, 2006

S&P 500 Dividends

I was looking at the Standard & Poor's website today when I discovered a file posted there containing historical dividend information for the S&P 500 dating back to 1988. I have entered this historical dividend information into the chart below. As shown, the dividends paid by the S&P 500 component companies increased from $9.73 in 1988 to $22.22 in 2005. That works out to an average annual increase of 4.978% in the dividend yield. That's impressive, especially considering that this time period includes the horrible bear market from 2000 to 2002 when the S&P 500 lost around 50% of its value.

As shown below, the annual % increase of dividends has been increasing very rapidly since 2002. That is undoubtedly due to the strong corporate profits and the dividend tax decrease that Congress passed in 2003. According to Standard & Poor's, the dividends are projected to increase to $24.50 for 2006, a 10.26% increase over 2005.

I anticipate large % increases in the dividend rate in the coming years. With the favorable tax treatment and Baby Boomers nearing retirement age, the Boomers are going to want extra dividend income and will pressure companies to keep raising dividends. This is definitely a plus for investors. The great thing about dividends is that they provide investors with a return without forcing the investors to sell at inopportune moments to realize these returns.


***An updated version of this chart containing data from 1977-2014 may be found in this post.

Friday, December 16, 2005

Pfizer raised its quarterly dividend by 26% this week!

Early this week, Pfizer announced that it was raising its quarterly dividend by 26%, from 19 cents per share to 24 cents per share. With Pfizer currently trading at about $22.70 per share, its annual dividend payouts will be 96 cents, giving it a dividend yield of just over 4.2%! Even though Pfizer's stock (symbol: PFE) is trading around where it was in 1997, its forward PE is a mere 11, about than 1/5 of what it was in 1998.

Even if Pfizer's earnings don't accelerate in the next couple of years, it is still the 800-lb gorilla of the drug industry, generating billions of dollars in free cash flow and spending upwards of $7 billion on R&D annually. If nothing else, its dividend makes Pfizer look extremely attractive to me. Also, Pfizer has a long history of raising its divdends each year, so the annual dividend payouts should keep rising every year.

I think Pfizer's a steal at just $22.70 per share.